

Other
Introducing Fishbowl’s XML Feed Connector for Google Cloud Search
Last November, Google released Cloud Search with third-party connectivity. While not a direct replacement for the Google Search Appliance (GSA), Google Cloud Search is Google’s next-generation search platform and is an excellent option for many existing GSA customers whose appliances are nearing (or past) their expiration. Fishbowl is aiming to make the transition for GSA customers even easier with our new XML Feed Connector for Google Cloud Search.
One of the GSA’s features was the ability to index content via custom feeds using the GSA Feeds Protocol. Custom XML feed files containing content, URLs, and metadata could be pushed directly to the GSA through a feed client, and the GSA would parse and index the content in those files. The XML Feed Connector for Google Cloud Search brings this same functionality to Google’s next-generation search platform, allowing GSA customers to continue to use their existing XML feed files with Cloud Search.
Our number one priority with the XML Feed Connector was to ensure that users would be able to use the exact same XML feed files they used with the GSA, with no modifications to the files required. These XML feed files can provide content either by pointing to a URL to be crawled, or by directly providing the text, HTML, or compressed content in the XML itself. For URLs, the GSA’s built-in web crawler would retrieve the content; however, Google Cloud Search has no built-in crawling capabilities. But fear not, as our XML Feed Connector will handle URL content retrieval before sending the content to Cloud Search for indexing. It will also extract the title and metadata from any HTML page or PDF document retrieved via the provided URL, allowing the metadata to be used for relevancy, display, and filtering purposes. For content feeds using base-64 compressed content, the connector will also handle decompression and extraction of content for indexing.
In order to queue feeds for indexing, we’ve implemented the GSA’s feed client functionality, allowing feed files to be pushed to the Connector through a web port. The same scripts and web forms you used with the GSA will work here. You can configure the HTTP listener port and restrict the Connector to only accept files from certain IP addresses.
Another difference between the GSA and Google Cloud Search is how they handle metadata. The GSA would accept and index any metadata provided for an item, but Cloud Search requires you to specify and register a structured data schema that defines the metadata fields that will be accepted. There are tighter restrictions on names of metadata fields in Cloud Search, so we implemented the ability to map metadata names between those in your feed files and those uploaded to Cloud Search. For example, let’s say your XML feed file has a metadata field titled “document_title”. Cloud Search does not allow for underscores in metadata definitions, so you could register your schema with the metadata field “documenttitle”, then using the XML Feed Connector, map the XML field “document_title” to the Cloud Search field “documenttitle”.
Here is a full rundown of the supported features in the XML Feed Connector for Google Cloud Search:
- Full, incremental, and metadata-and-url feed types
- Grouping of records
- Add and delete actions
- Mapping of metadata
- Feed content:
- Text content
- HTML content
- Base 64 binary content
- Base 64 compressed content
- Retrieve content via URL
- Extract HTML title and meta tags
- Extract PDF title and metadata
- Basic authentication to retrieve content from URLs
- Configurable HTTP feed port
- Configurable feed source IP restrictions
Of course, you don’t have to have used the GSA to benefit from the XML Feed Connector. As previously mentioned, Google Cloud Search does not have a built-in web crawler, and the XML Feed Connector can be given a feed file with URLs to retrieve content from and index. Feeds are especially helpful for indexing html content that cannot be traversed using a traditional web/spidering approach such as web applications, web-based content libraries, or single-page applications. If you’d like to learn more about Google Cloud Search or the XML Feed Connector, please contact us.
Fishbowl Solutions is a Google Cloud Partner and authorized Cloud Search reseller.
The post Introducing Fishbowl’s XML Feed Connector for Google Cloud Search appeared first on Fishbowl Solutions.
Automate your PDMWorks, EPDM, and File System to PTC Windchill Data Migrations Using Fishbowl’s LinkLoader
Companies don’t invest in Windchill so they can execute lengthy, complicated, expensive data migration projects. They invest in Windchill so they can realize the benefits of a well-executed PLM strategy. However, the lynchpin of a good Windchill deployment is getting accurate data into Windchill…and the faster it happens, the faster a company can move on their PLM strategy.
Fishbowl Solutions has worked with numerous customers on enterprise data migration projects over the years. When many companies first deploy Windchill their migration projects are dealing with CAD data and documents. Manually loading CAD data is far too time consuming. As mentioned, these activities are vital to success, but why waste valuable engineering resources that can be better utilized on engineering work.
Fishbowl Solutions has the LinkLoader family of apps that automate the loading of files/data into Windchill PDMLink. When it comes to CAD data and documents, the files might be on the network file system (NFS) or from 3rd party PDM, such as EPDM or PDMWorks. In fact, migrating Solidworks into Windchill PDMLink is probably the busiest I have ever seen.
Please note that Fishbowl can do a lot more than just migrate Solidworks from the file system, but hopefully this gives a little detail to some types of projects.
To read the rest of this blog post, please visit the PTC LiveWorx 2019 blog.
The post Automate your PDMWorks, EPDM, and File System to PTC Windchill Data Migrations Using Fishbowl’s LinkLoader appeared first on Fishbowl Solutions.
Four Types of Mindbreeze Relevancy Boostings and How to Use Them
Strong relevancy is critical to a well-adopted search solution. Mindbreeze provides several ways to fine tune relevancy which they refer to as boosting. This post will explore how boosting works and four ways to apply boosting rules within Mindbreeze.
About Boosting & Rank ScoresBefore we start altering relevancy, it’s important to examine how boosting works within Mindbreeze. Mindbreeze provides a baseline algorithm with factors such as term frequency, term proximity, freshness, etc. (while there are ways to alter these core signals, we’ll save that topic for another time). Boostings address many common relevancy-adjustment use cases and are the easiest way to alter rankings. Boosting are applied to the baseline rankings by configured amount. Although the term “boost” generally implies an increase, boosting can used to increase or decrease rank scores relative to the baseline.
Mindbreeze boostings are factor-based (i.e. multiplicative). For example, a boost factor of 2.0 would make something twice as relevant as the baseline, while a boost factor of 0.5 would make it half as relevant. For this reason, it’s helpful to monitor rankings (called rank scores) before and after boosting, in order to determine an appropriate boosting factor. Mindbreeze provides two options for viewing ranks scores as described below.
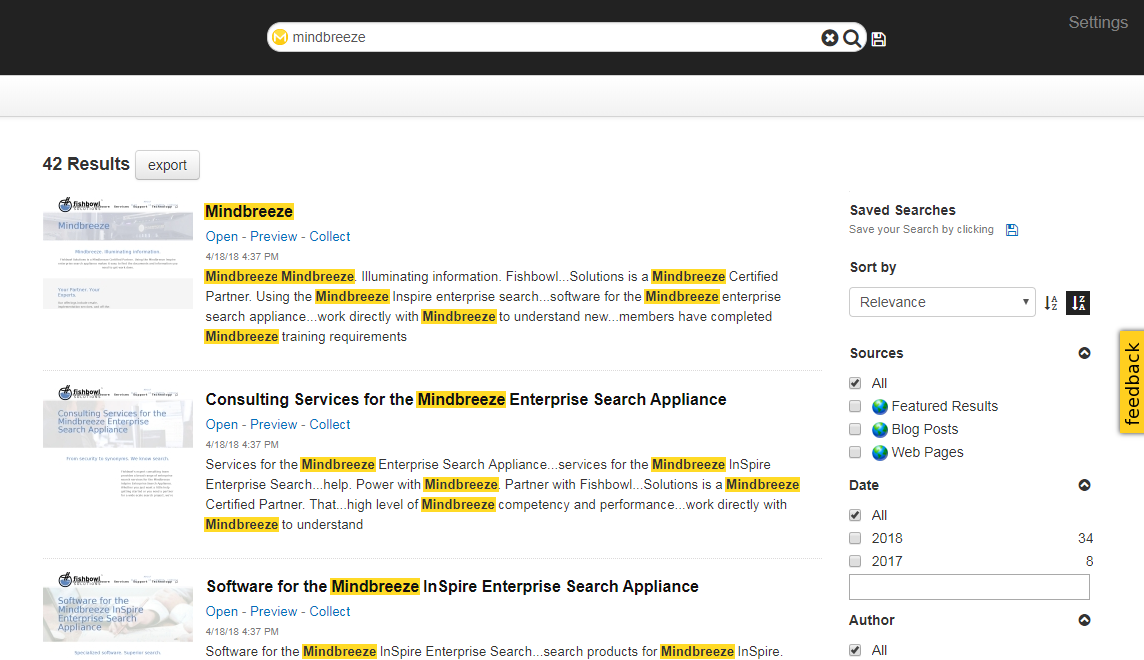
Viewing Rank using the ExportThe easiest way to see the rank of multiple search results is to use the export feature. From the default Mindbreeze search client, perform your search and select Export. In the Export results window, select the plus sign (+) and add “mes:hitinfo:rank” to the visible columns. You can simply start typing “rank” in the input box and this column name will appear.
Viewing Rank within JSON ResultsIf using the Export feature is not available, or you need to test rankings that are specific to a custom search application, you can also view the rank within the Mindbreeze JSON response for a search request. Follow these instructions to do so:
- Open the developer-tools dock in your browser (F12).
- Navigate to the Network tab.
- Perform your search.
- Expand the search request.
- View the response body and drill down into the search request response data to find the desired rank. For example, to see the rank of the first result, you would select result set > results > 0 > rank_score.
For more information on the data contained in the search response, see the Mindbreeze documentation on api.v2.search.
Term2document BoostingTerm2DocumentBoost is a Mindbreeze query transformation plugin which allows you to apply relevance tuning to specific search queries (or all queries) based on defined rules. It is the primary way to adjust relevancy within Mindbreeze. The plugin gets configured either for a specific index or globally. If you configure an index-specific boosting file, those rules will be applied instead of (not in addition to) the global rules. If you’d like to apply both set of the rules, the global rules should be copied into the index-specific boosting file as each index can only reference one file at a time.
Term2Document boosting rules will always be applied to searches against the indices for which they are configured, so their best used for static boosting as opposed to the more dynamic boosting options described in later sections. Term2Document boosting can be used to increase the relevance of certain documents for specific search queries. For example, a search for “news” can be tuned so that documents with the “post-type” metadata value “newsarticle” will have higher relevance. Term2Document boosting can also be used to generally increase the relevance of certain documents based on any combination of metadata-value pairs. For example, all documents from a “Featured Results” data source, or all documents from the “products” section of a website. Rules can use regular expressions to accommodate more complex patterns. In the second to last example below, we show how pages one-level off the root of a website can be boosted using a regular expression.
The Term2Document Boost file uses five columns to apply boosting rules.
- Term: This is the search term you want to trigger the rule. Leave this blank to trigger the rule for all searches.
- Key: The name of the metadata field on which content to be boosted will be identified. If you want to boost documents matching a pattern in the full text of the document contents, the “Key” column should contain the word “content”.
- Pattern: A term or pattern that determines the metadata value on which content to be boosted will be identified. This column supports regular expressions. Please note, any fields you wish to boost in this way should be added to the Aggregated Metadata Keys configuration for the respective indices in order to enable regex matching.
- Boost: The boost factor. Values less than one (e.g. 0.5) should be preceded by a zero (i.e. 0.5 not .5).
- Query: Optional column for advanced configuration. Instead of specifying a Term, Key, and Pattern, you can use this column to create more flexible boosting rules via the Mindbreeze query language. This is helpful when you want to change the boosting rule for each user’s query. For example, if someone searches for a person (e.g. “John Doe”), documents with this person as the Author (i.e. stored in the Author metadata) can be boosted. This is shown in the last example below.
Term
Key
Pattern
Boost
Query
news
post-type
newsarticle
5
datasource/fqcategory
DataIntegration:FeaturedResults
100
key
.*\/products.*
1.5
key
^http:\/\/[^\/]*\/[^\/]*$
2.5
2.0
Author:{{query}}
Additional information can be found in the Mindbreeze documentation on the Term2DocumentBoost Transformer Plugin.
Category Descriptor BoostingMindbreeze uses an XML file called the CategoryDescriptor to control various aspects of the search experience for each data source category (e.g. Web, DataIntegration, Microsoft File, etc.). Each category plugin includes a default CategoryDescriptor which can be extended or modified to meet your needs.
You may modify the CategoryDescriptor if you wish to add localized display labels for metadata field names or alter the default metadata visible from the search results page. In this case, we’re focused on how you can use it to boost the overall impact of a metadata field on relevancy. This is common if you wish to change the impact of a term’s presence in certain field over others. Common candidates for up-boosting include title, keywords, or summary. Candidates for down-boosting may include ID numbers, GUIDs, or other values which could yield confusing or irrelevant results in certain cases.
The default CategoryDescriptor is located in the respective plugin’s zip file. You can extract this file and modify it as needed.
Category Descriptor ExampleThe example below shows the modification of two metadatum entries. The first, for Keywords, boosts the importance of this field by a factor of 5.0. The second, for Topic, adds a boost factor of 2.0 and localized display labels for four languages.
<?xml version=”1.0″ encoding=”UTF-8″?>
<category id=”MyExample” supportsPublic=”true”>
<name>My Example Category</name>
<metadata>
<metadatum aggregatable=”true” boost=”5.0″ id=”Keywords” selectable=”true” visible=”true”>
</metadatum>
<metadatum aggregatable=”true” boost=”2.0″ id=”Topic” selectable=”true” visible=”true”>
<name xml:lang=”de”>Thema</name>
<name xml:lang=”en”>Topic</name>
<name xml:lang=”fr”>Sujet</name>
<name xml:lang=”es”>Tema</name>
</metadatum>
… additional metadatum omitted for brevity …
</metadata>
</category>
Applying a Custom Category DescriptorThe easiest way to apply a custom category descriptor is to download a copy of the respective plugin from the Mindbreeze updates page. For example, if you wanted to change relevancy for crawled content, you would download Mindbreeze Web Connector.zip. Unzip the file and look for the categoryDescriptor.xml file which is located in Mindbreeze Web Connector\Web Connector\Plugin\WebConnector-18.1.4.203.zip (version number may vary).
Please note, if you update a plugin on the Mindbreeze appliance, your custom CategoryDescriptor will be overwritten. Keep a copy saved in case you need to reapply it after updating. Additional information can be found in the Mindbreeze documentation on Customizing the Category Descriptor.
Inline BoostingBoosting can be set at query time using the Mindbreeze query language. This can be either done directly in the query box or as part of the search application’s design by applying it to the constraint property. This functionality can be leveraged to create contextual search by dynamically boosting results based on any number of factors and custom business logic.
For example:
- ALL (company:fishbowl)^3.5 OR NOT (company:fishbowl)
Returns all results and ranks items with fishbowl in the company metadata field 3.5 times higher than other results.
- (InSpire^2.0 OR “InSite“) AND “efficient“
Results must contain InSpire or InSite and efficient. Occurrences of InSpire are twice as relevant as other terms.
- holiday AND ((DocType:Policy)^5 OR (DocType:Memo))
Returns results which contain holiday and a DocType value of Policy or Memo. Ranks items with Policy as their DocType 5 times higher than those with the DocType of Memo.
JavaScript BoostingJavaScript boosting is similar to inline boosting in that it is also set at query time. It serves many of the same use cases as inline boosting, but can provide a cleaner implementation for clients already working within the Mindbreeze client.js framework. The examples below show how to apply boosting to three different scenarios. Please note, any fields you wish to boost in this way should be added to the Aggregated Metadata Keys configuration for the respective indices in order to enable regex matching.
ExamplesThis example ranks items with fishbowl in the company metadata field 3.5 times higher than other results. For comparison, this rule would have the same effect on rankings as the inline boosting shown in the first example within the previous section.
var application = new Application({});
application.execute(function (application) {
application.models.search.set(“boostings.fishbowl”, {
factor: 3.5,
query_expr: {
label: “company”, regex: “^fishbowl$”
}
}, { silent: true });
});
This example ranks results with a department value of accounting 1.5 times higher than other results. This can be modified to dynamically set the department to a user’s given department. For example, accounting may wish to see accounting documents boosted whereas the engineering team would want engineering documents boosted. Please note, setting this dynamically requires access the user’s department data which is outside the scope of the Mindbreeze search API but is often accessible within the context of an intranet or other business application.
var application = new Application({});
application.execute(function (application) {
application.models.search.set(“boostings.accounting”, {
factor: 1.5,
query_expr: {
label: “department”, regex: “^accounting$”
}
}, { silent: true });
});
This example shows how dynamic, non-indexed information (in this case, the current time) can be used to alter relevancy. Results with a featuredmeals value of dinner are boosted by a factor of 3 when the local time is between 5 PM and 10 PM. This could be extended to boost breakfast, brunch, and lunch, for their respective date-time windows which would be helpful if users were searching for restaurants or other meal-time points of interest.
var application = new Application({});
application.execute(function (application) {
var now = new Date().getHours();
if (now >= 17 && now <= 22) {
application.models.search.set(“boostings.dinner”, {
factor: 3.0,
query_expr: {
label: “featuredmeals”, regex: “.*dinner.*”
}
}, { silent: true });
}
});
As you can see, Mindbreeze offers a variety of options for relevancy adjustments. If you have any questions about our experience working with Mindbreeze or would like to know more, please contact us.
The post Four Types of Mindbreeze Relevancy Boostings and How to Use Them appeared first on Fishbowl Solutions.
Leveraging Google Cloud Search to Provide a 360 Degree View to Product Information Existing in PTC® Windchill® and other Data Systems
Most organizations have silos of content spread out amongst databases, file shares, and one or more document management systems. Without a unified search system to tap into this information, knowledge often remains hidden and the assets employees create cannot be used to support design, manufacturing, or research objectives.
An enterprise search system that can connect these disparate content stores and provide a single search experience for users can help organizations increase operational efficiencies, enhance knowledge sharing, and ensure compliance. PTC Windchill provides a primary source for the digital product thread, but organizations often have other key systems storing valuable information. That is why it is critical to provide workers with access to associated information regardless of where it is stored.
This past August, Fishbowl released its PTC Windchill Connector for Google Cloud Search. Fishbowl developed the connector for companies needing a search solution that allows them to spend less time searching for existing information and more time developing new products and ideas. These companies need a centralized way to search their key engineering information stores, like PLM (in this case Windchill), ERP, quality database, and other legacy data systems. Google Cloud Search is Google’s next generation, cloud-based enterprise search platform from which customers can search large data sets both on-premise and in the cloud while taking advantage of Google’s world-class relevancy algorithms and search experience capabilities.
Connecting PTC Windchill and Google Cloud SearchThrough Google Cloud Search, Google provides the power and reach of Google search to the enterprise. Fishbowl’s PTC Windchill Connector for Google Cloud Search provides customers with the ability to leverage Google’s industry-leading technology to search PTC Windchill for Documents, CAD files, Enterprise Parts, Promotion Requests, Change Requests, and Change Notices. The PTC Windchill Connector for Google Cloud Search assigns security to all items indexed through the connector based on the default ACL configuration specified in the connector configuration. The connector allows customers to take full advantage of additional search features provided by Google Cloud Search including Facets and Spelling Suggestions just as you would expect from a Google solution.
To read the rest of this blog post and see an architecture diagram showing how Fishbowl connects Google Cloud Search with PTC Windchill, please visit the PTC LiveWorx 2019 blog.
The post Leveraging Google Cloud Search to Provide a 360 Degree View to Product Information Existing in PTC® Windchill® and other Data Systems appeared first on Fishbowl Solutions.
Fishbowl Resource Guide: Solidworks to PTC Windchill Data Migrations

Fishbowl has helped numerous customers migrate Solidworks data into PTC Windchill. We have proven processes and proprietary applications to migrate from SolidWorks Enterprise PDM (EPDM) and PDMWorks, and WTPart migrations including structure and linking. This extensive experience combined with our bulk loading software has elevated us as one of the world’s premiere PTC Data Migration specialists.
Over the years, we’ve created various resources for Windchill customers to help them understand their options to migrate Solidworks data into Windchill, as well as some best practices when doing so. After all, we’ve seen firsthand how moving CAD files manually wastes valuable engineering resources that can be better utilized on more important work.
We’ve categorized those resources below. Please explore them and learn how Fishbowl Solution can help you realize the automation gains you are looking for.
Blog Posts Infographic Webinar Brochures LinkLoader Web PageThe post Fishbowl Resource Guide: Solidworks to PTC Windchill Data Migrations appeared first on Fishbowl Solutions.
The wait is over! Google Cloud Search with third-party connectivity is now available. Here’s what you need to know.
This month, Google Cloud opened the general availability of Cloud Search with third-party connectivity. This is an evolution of the Cloud Search available across G Suite, the set of cloud-native intelligent productivity and collaboration apps including Gmail, Drive and Docs. We’ve been working with pre-release versions of Cloud Search since January and are excited to finally share the news and capabilities of this exciting new functionality more broadly. This version supports third-party connectors and integrations with non-Google data sources both on-premise and in the cloud opening up use to all enterprise customers.
What is Google Cloud Search?Google Cloud Search combines Google’s search expertise with features customized for business. Cloud Search can index both G Suite content like Gmail and Drive as well as third-party data both on-premise and in the cloud. This provides a unified search experience and enforces document-level permissions already in place in your repositories. Cloud Search boasts Google’s industry-leading machine learning relevancy and personalization to bring the speed, performance and reliability of Google.com to enterprise customers.
Who can use Cloud Search?Any enterprise can purchase Cloud Search as a standalone platform edition regardless of whether you use other Google products such as G Suite or Google Cloud Platform. If users in your domain already has G Suite Enterprise licenses, they will now be able to access results from third-party data via the Cloud Search application provided as part of the G Suite. You will be allotted a fixed quota of third-party data that you can index, based on the number of Enterprise licenses. G Suite customers can also purchase the standalone platform edition if additional quota or search applications are required.
What’s new in this release? Third-Party Data Source ConnectorsTo enable easy indexing of third-party data both on-premise and in the cloud, Google Cloud has released the following reference connectors.
- Database
- CSV
- Crawler Plugins for Apache Nutch and Norconex HTTP Collector
- Windows Files System
- SharePoint On-Premise (2013, 2016)
- SharePoint Online
While the above list covers many popular sources, numerous other data sources exist within individual organizations. For this reason, Google Cloud also released content and identity SDKs to enable custom connector development. Fishbowl has been working with these SDKs for nearly a year and we’ve released the following connectors for Cloud Search:
Embeddable Search WidgetAs part of this release, Google Cloud has introduced two new options for consuming search results that include third-party data. The first is an embeddable search widget which provides a customizable search interface for use within an organization’s internal web applications. With only a small amount of HTML and JavaScript, the widget enables customers to integrate with Cloud Search. Using the search widget offers common search features such as facets and pagination while minimizing required development efforts. You can customize components of the interface with your own CSS and JavaScript if desired.
Query APIThe second new search option is the Cloud Search Query API. The API provides search and suggest services for creating fully custom search interfaces powered by Cloud Search. It also offers more flexibility than the search widget when embedding search results in an existing application.
Note that in addition to the API and search widget, Google Cloud also offers a pre-built search interface available to customers at cloudsearch.google.com and via Google’s Cloud Search mobile apps available for iOS and Android. These interfaces now support the inclusion of third-party results.
Is this a replacement for Google Search Appliance?Cloud Search is Google’s next-generation search platform. It is not a GSA in the Cloud but may be an excellent replacement option for many GSA customers. GSA customers who sign a 2-year Cloud Search contract before the end of the year can extend their appliances through the end of 2019 if needed. Google is also offering these customers a 30% discount on their first year of Cloud Search. If you have a GSA that is approaching expiration and are wondering whether Cloud Search would be a good fit, please contact us.
What’s next?If you’d like to learn more about Google Cloud Search, schedule a demo, or discuss whether your search use case is a good fit, please get in touch.
Fishbowl Solutions is a Google Cloud Partner and authorized Cloud Search reseller.
The post The wait is over! Google Cloud Search with third-party connectivity is now available. Here’s what you need to know. appeared first on Fishbowl Solutions.
Using the Mindbreeze client.js File to Create Custom Search Interfaces
This post describes how to create custom Mindbreeze search interfaces using the built-in Mindbreeze client.js file. This post is a follow up to our post on Four Options for Creating Mindbreeze Search Interfaces where we mention Option 3 is creating custom Mindbreeze web applications.
For this example, I will be using my local web server with XAMPP for Windows which uses Apache in the background. Setting up XAMPP is beyond the scope of this blog post, but this approach can be taken with any web server or architecture.
The widgets and html snippet references in the post are based on the following documentation from the Mindbreeze website: Development of Search Apps.
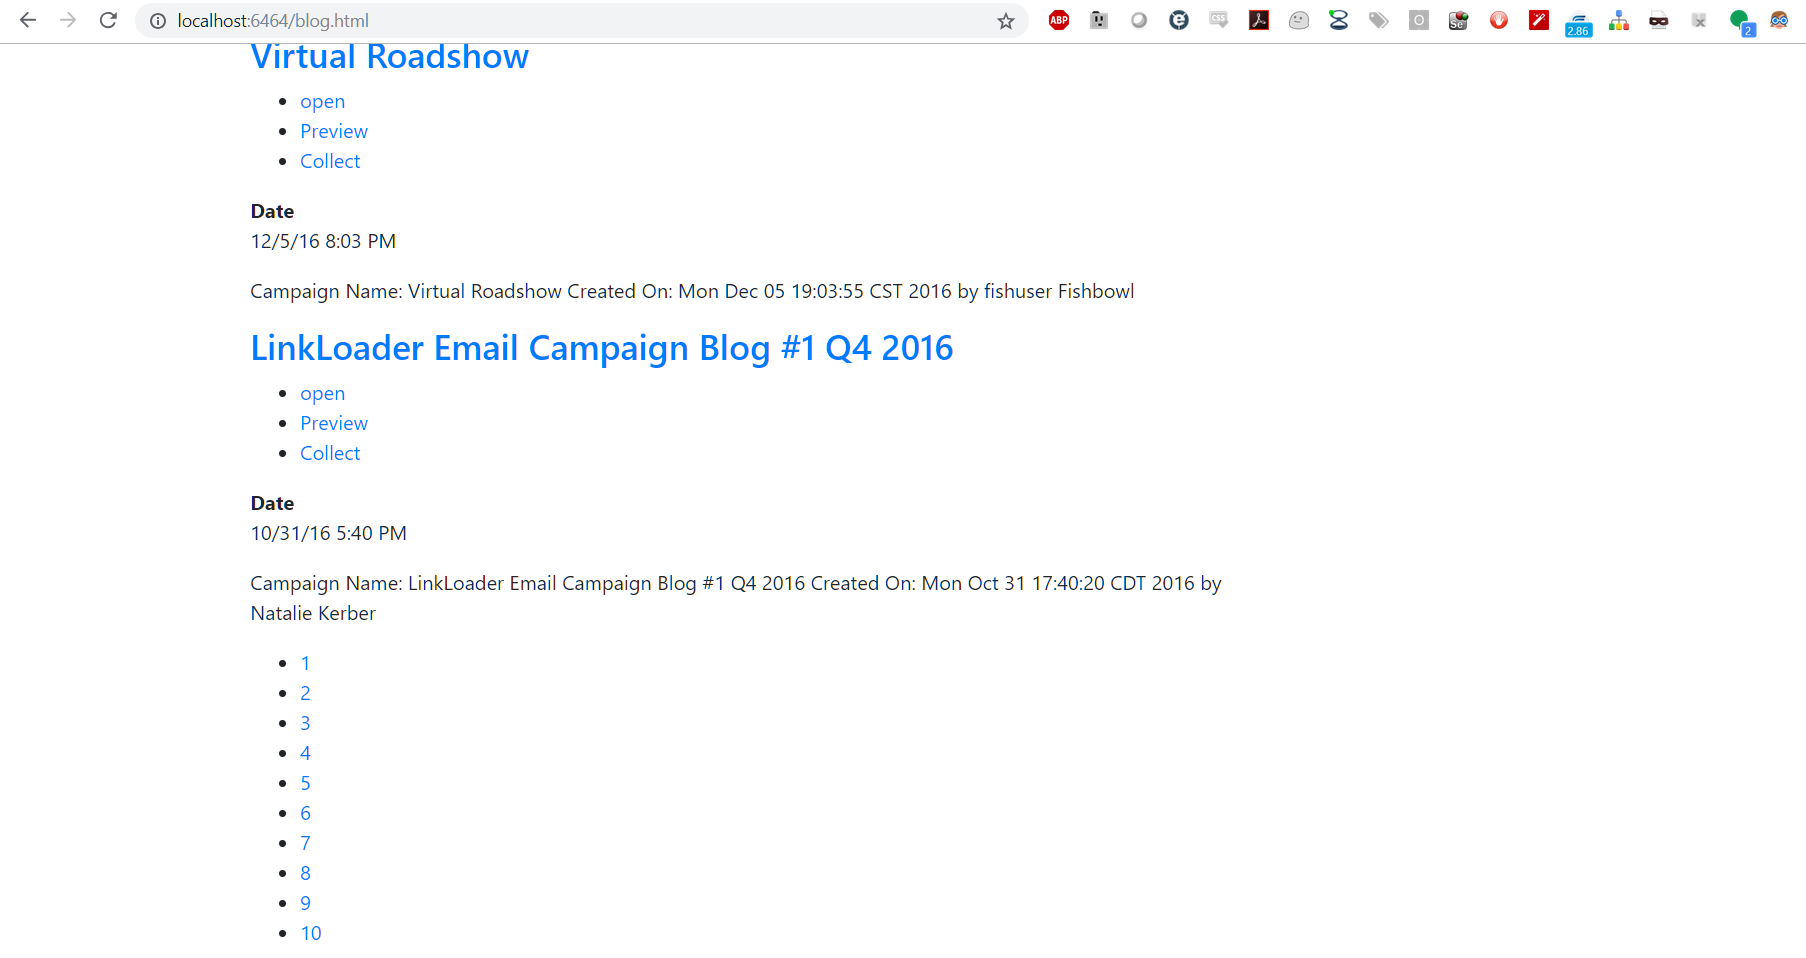
Creating a Basic Search PageTo begin, I created a blog.html file referencing Mindbreeze’s client.js file and using RequireJS to load the Mindbreeze search application. To do this, I created a new application object and told the page where the starting <div> block is using the rootEl property of the application. Since I did not want the page to run a blank search right away, I also added the startSearch property and set it to false.
There are a few mustache templates that I injected onto the page by copying and pasting from the default Mindbreeze search application (index.html). I then removed some of the optional elements to create a no-frills search page as shown in the snippet below. I’ve included the templates for result count and spelling suggestions, which are contained in the searchinfo and results templates respectively.
<html>
  <head>
    <title>Mindbreeze Search</title>
  </head>
  <body>
    <script src="https://mindbreeze.fishbowlsolutions.com:23352/apps/scripts/client.js" data-global-export="false"></script>
    <script>
      Mindbreeze.require(["client/application"], function (Application) {
        var application = new Application({
          rootEl: document.getElementById("searchresults"),
          startSearch: false,
        });
      });
  </script>
    <div id="searchresults">
      <div data-template="view" data-count="10" data-constraint="ALL">
        <script type="text/x-mustache-template" data-attr-role="status" data-attr-class="{{^estimated_count?}}hide{{/estimated_count?}}"
          data-attr-tabindex="-1">
          {{^status_messages.no_results?}}
          <h3>
            {{#estimated_count?}}
              {{estimated_count}} {{i18n.editor_result_title}}
            {{/estimated_count?}}
          </h3>
          {{/status_messages.no_results?}}
        </script>
        <div data-template="searchinfo"></div>
        <div data-template="results" class="media-list list-group">
        </div>
      </div>
    </div>
  </body>
</html>
Navigating to this page with a query parameter (e.g. ?query=ALL) returns a simple search results list without any styling.
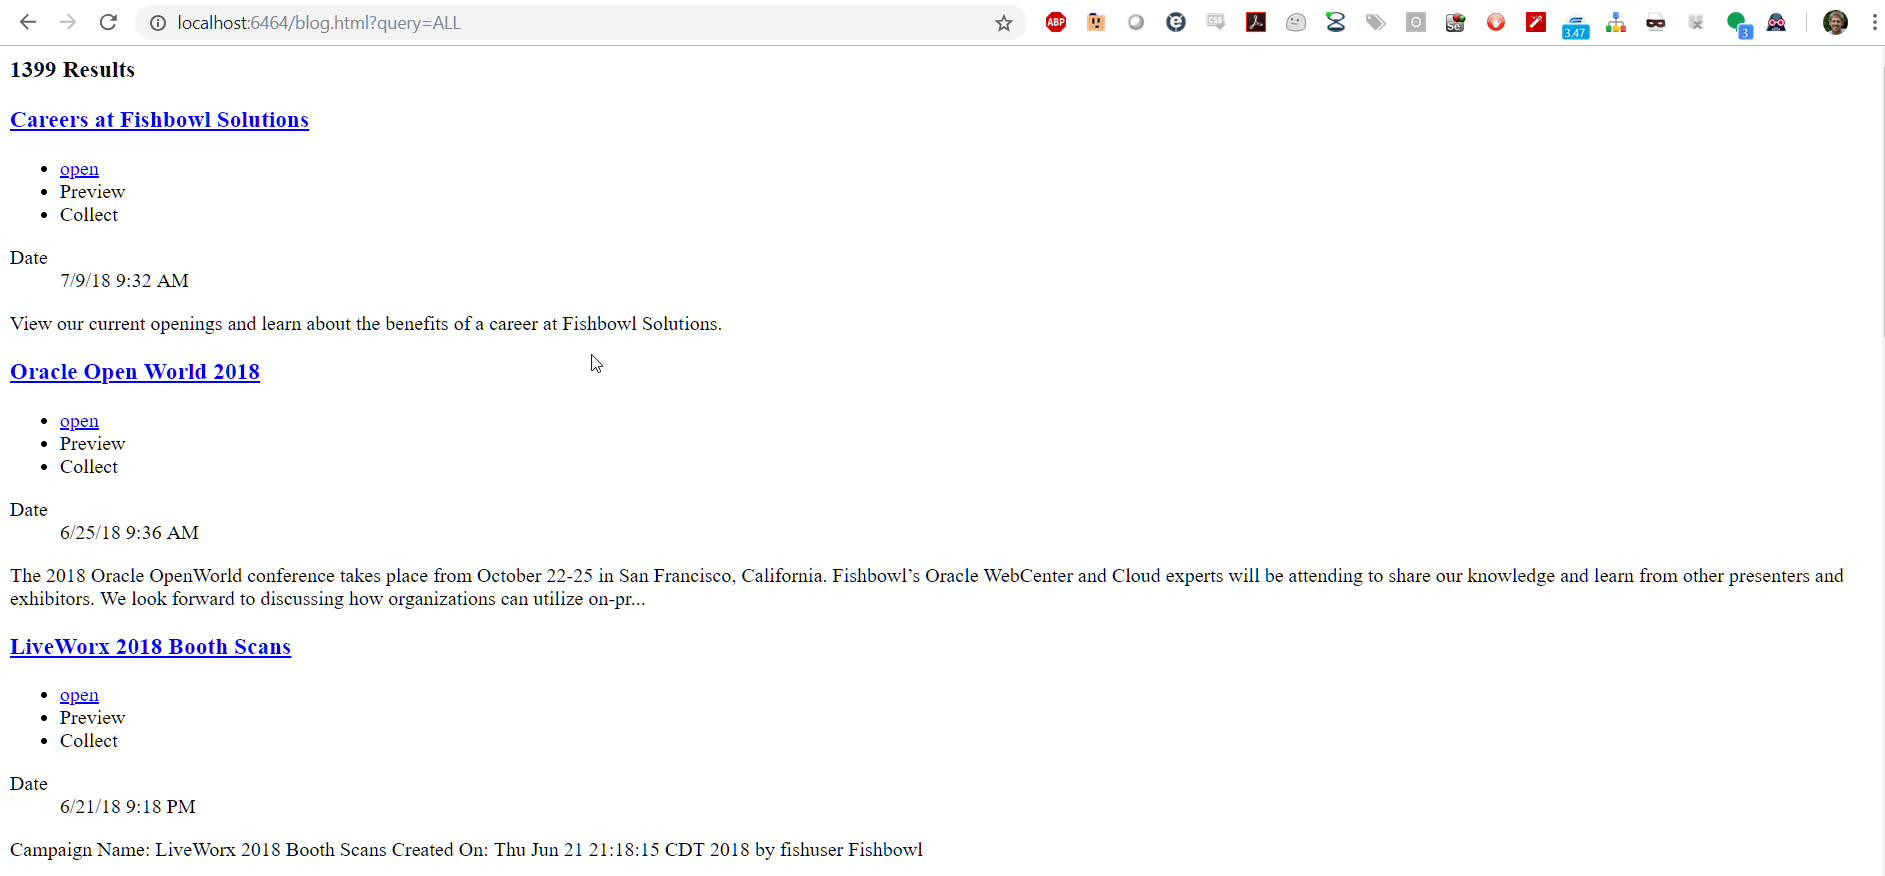
We can now add our own custom styling to the page. I added the Bootstrap CDN, along with jQuery to style my page.
<link rel="stylesheet" href="https://maxcdn.bootstrapcdn.com/bootstrap/4.0.0/css/bootstrap.min.css" integrity="sha384-Gn5384xqQ1aoWXA+058RXPxPg6fy4IWvTNh0E263XmFcJlSAwiGgFAW/dAiS6JXm" crossorigin="anonymous">
    <script src="https://code.jquery.com/jquery-3.2.1.slim.min.js" integrity="sha384-KJ3o2DKtIkvYIK3UENzmM7KCkRr/rE9/Qpg6aAZGJwFDMVNA/GpGFF93hXpG5KkN" crossorigin="anonymous"></script>
    <script src="https://cdnjs.cloudflare.com/ajax/libs/popper.js/1.12.9/umd/popper.min.js" integrity="sha384-ApNbgh9B+Y1QKtv3Rn7W3mgPxhU9K/ScQsAP7hUibX39j7fakFPskvXusvfa0b4Q" crossorigin="anonymous"></script>
    <script src="https://maxcdn.bootstrapcdn.com/bootstrap/4.0.0/js/bootstrap.min.js" integrity="sha384-JZR6Spejh4U02d8jOt6vLEHfe/JQGiRRSQQxSfFWpi1MquVdAyjUar5+76PVCmYl" crossorigin="anonymous"></script>
    <script defer src="https://use.fontawesome.com/releases/v5.0.13/js/all.js" integrity="sha384-xymdQtn1n3lH2wcu0qhcdaOpQwyoarkgLVxC/wZ5q7h9gHtxICrpcaSUfygqZGOe" crossorigin="anonymous"></script>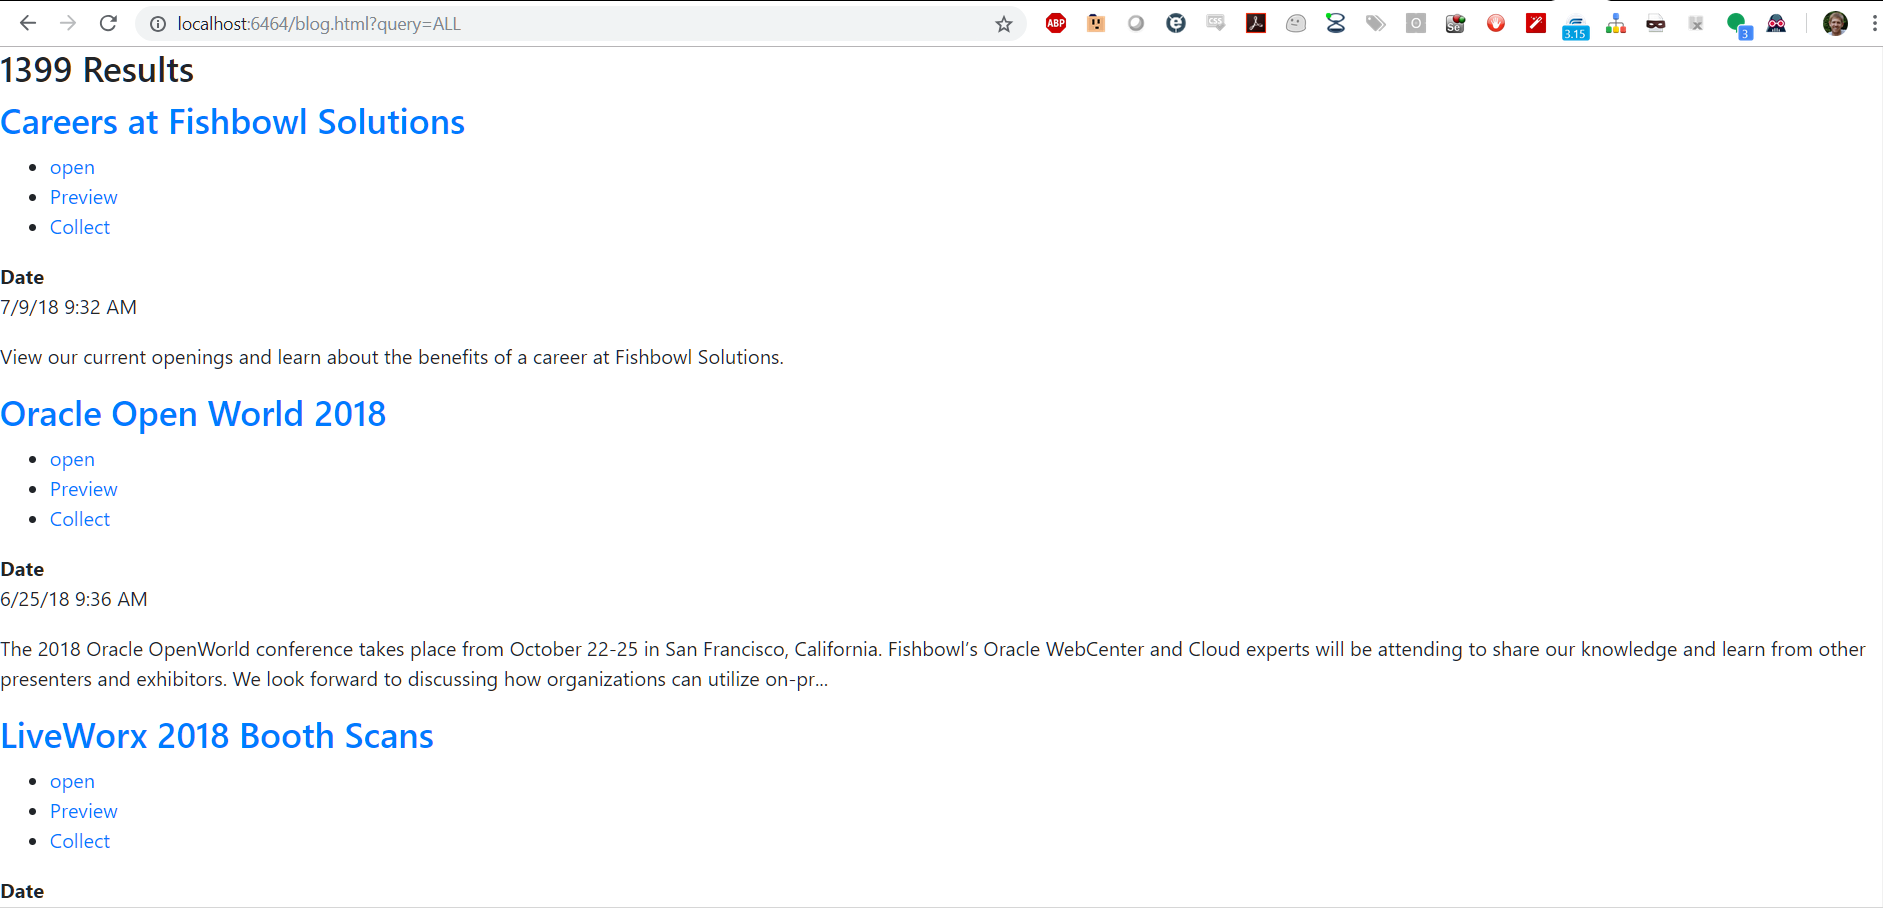
Adding some bootstrap class information like container and col-md-9 for the results helps me quickly style the page for adding on facets.
There are two different types of facets that Mindbreeze offers: FilteredFacets and FilteredFacet. FilteredFacets allow for the configuration page in the Management Center to control what facets are displayed on the page. FilteredFacet allows developers to manually add the desired facets individually. For this demonstration, I will be manually adding a facet using FilteredFacet. This is shown below with the addition of the facet for author.
<html>
<head>
  <title>Mindbreeze Search</title>
  <link rel="stylesheet" href="https://maxcdn.bootstrapcdn.com/bootstrap/4.0.0/css/bootstrap.min.css" integrity="sha384-Gn5384xqQ1aoWXA+058RXPxPg6fy4IWvTNh0E263XmFcJlSAwiGgFAW/dAiS6JXm"
    crossorigin="anonymous">
  <script src="https://code.jquery.com/jquery-3.2.1.slim.min.js" integrity="sha384-KJ3o2DKtIkvYIK3UENzmM7KCkRr/rE9/Qpg6aAZGJwFDMVNA/GpGFF93hXpG5KkN"
    crossorigin="anonymous"></script>
  <script src="https://cdnjs.cloudflare.com/ajax/libs/popper.js/1.12.9/umd/popper.min.js" integrity="sha384-ApNbgh9B+Y1QKtv3Rn7W3mgPxhU9K/ScQsAP7hUibX39j7fakFPskvXusvfa0b4Q"
    crossorigin="anonymous"></script>
  <script src="https://maxcdn.bootstrapcdn.com/bootstrap/4.0.0/js/bootstrap.min.js" integrity="sha384-JZR6Spejh4U02d8jOt6vLEHfe/JQGiRRSQQxSfFWpi1MquVdAyjUar5+76PVCmYl"
    crossorigin="anonymous"></script>
  <script defer src="https://use.fontawesome.com/releases/v5.0.13/js/all.js" integrity="sha384-xymdQtn1n3lH2wcu0qhcdaOpQwyoarkgLVxC/wZ5q7h9gHtxICrpcaSUfygqZGOe"
    crossorigin="anonymous"></script>
</head>
<body>
  <script src="https://mindbreeze.fishbowlsolutions.com:23352/apps/scripts/client.js" data-global-export="false"></script>
  <script>
    Mindbreeze.require(["client/application"], function (Application) {
        var application = new Application({
          rootEl: document.getElementById("searchresults"),
          startSearch: false,
        });
      });
  </script>
  <div id="searchresults" class="container">
    <div data-template="view" data-count="10" data-constraint="ALL">
      <!--Constraing is optional the same as in redirect of original page-->
      <script type="text/x-mustache-template" data-attr-role="status" data-attr-class="{{^estimated_count?}}hide{{/estimated_count?}}"
        data-attr-tabindex="-1">
        {{^status_messages.no_results?}}
          <h3>
            {{#estimated_count?}}
              {{estimated_count}} {{i18n.editor_result_title}}
            {{/estimated_count?}}
          </h3>
          {{/status_messages.no_results?}}
        </script>
      <div data-template="searchinfo"></div>
      <div class="row">
        <div class="col-md-9">
          <div data-template="results">
          </div>
        </div>
        <div class="col-md-3">
          <div data-template="filteredfacet" data-name="Author" data-container-tag-name="div" data-container-class-name="filter"
            data-entry-tag-name="div" data-entry-class-name="entry">
          </div>
        </div>
      </div>
    </div>
  </div>
</body>
</html>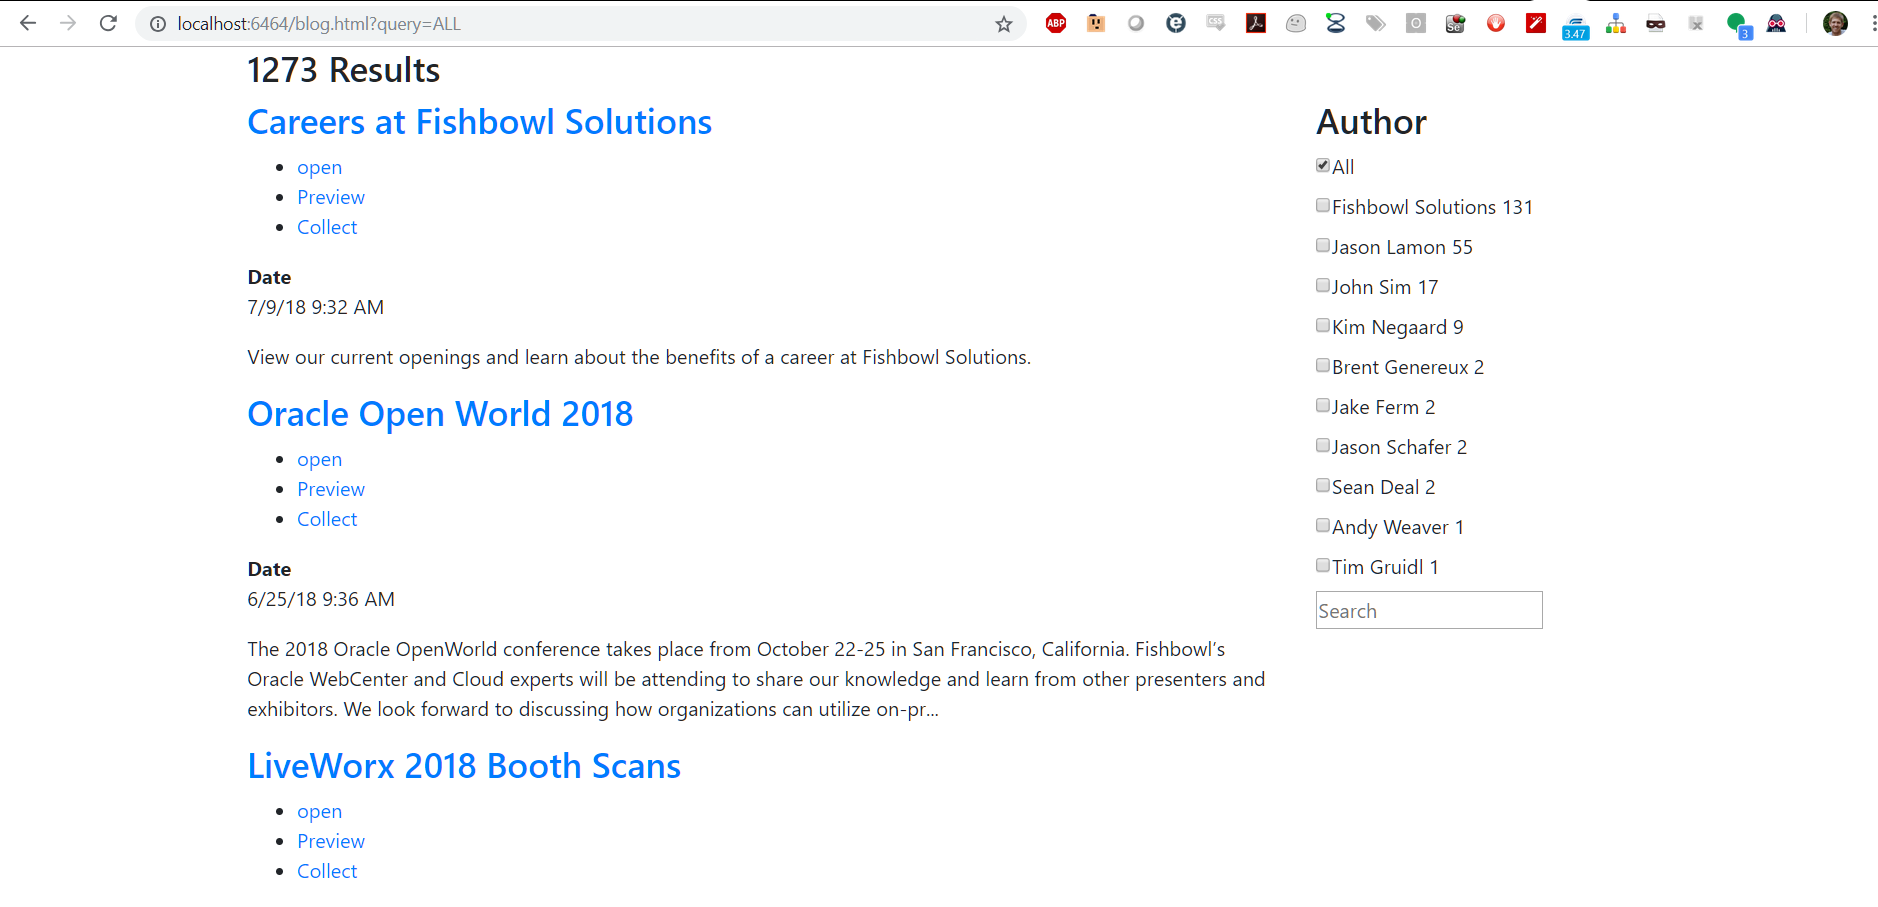
We can see that I now have the author field as a configured value. There are more configurations offered like changing the template of the results in the filter or HTML tags, allowing user input, and modifying the title label. Information on these options can be found here: Mindbreeze Filtered Facet Widget.
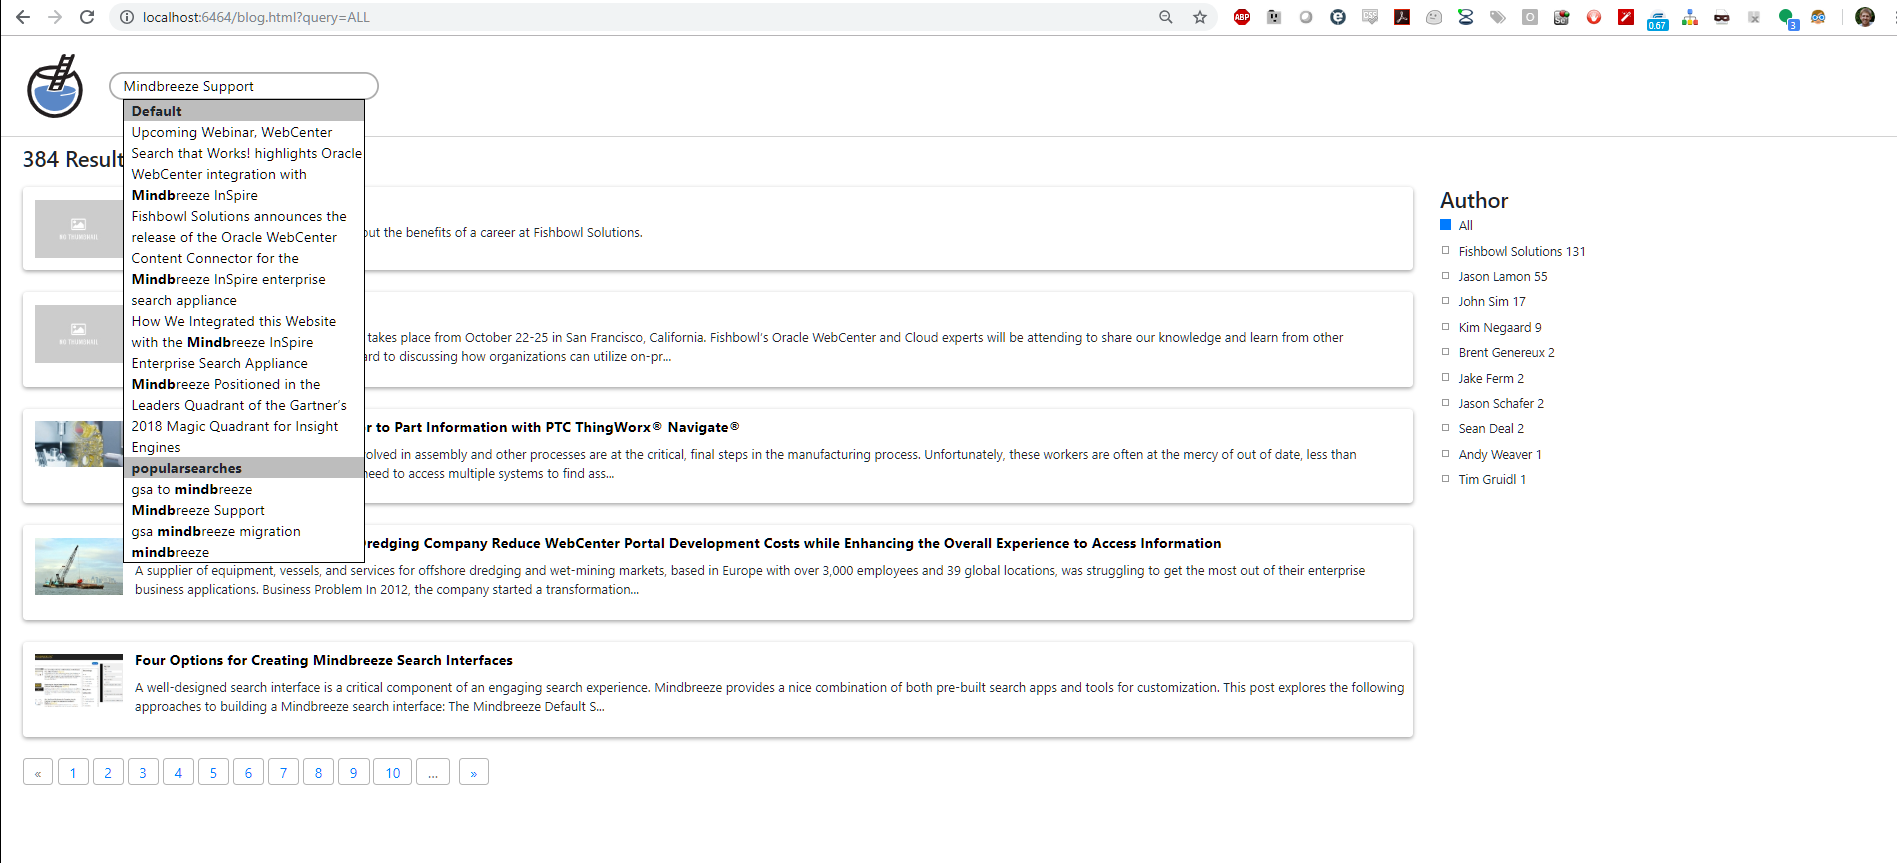
Now we will add the search form onto the page. This will allow suggestions to show up when a user is typing a query. You can add additional parameters to the input tag to tell Mindbreeze which data sources to run suggestions against like popular searches, recent searches, and document properties. This documentation is available here: Mindbreeze Suggestions.
We’ll style the suggestions in the next section.
<form class="center search-field mb-print-left" data-template="searchform" data-requires-user-input="true">
      <input data-template="suggest" data-disabled="false" data-placeholder="search" data-shortcut="alt+1" id="query" data-source-id-pattern="document_property|popularsearches" data-initial-source-id-pattern="document_property|popularsearches" data-grouped="true" class="" name="query" type="search" autofocus="" autocomplete="off" placeholder="Search">
      <button class="btn btn-link mb-no-print" type="submit" tabindex="-1"><i class="icon-search"></i></button>
    </form>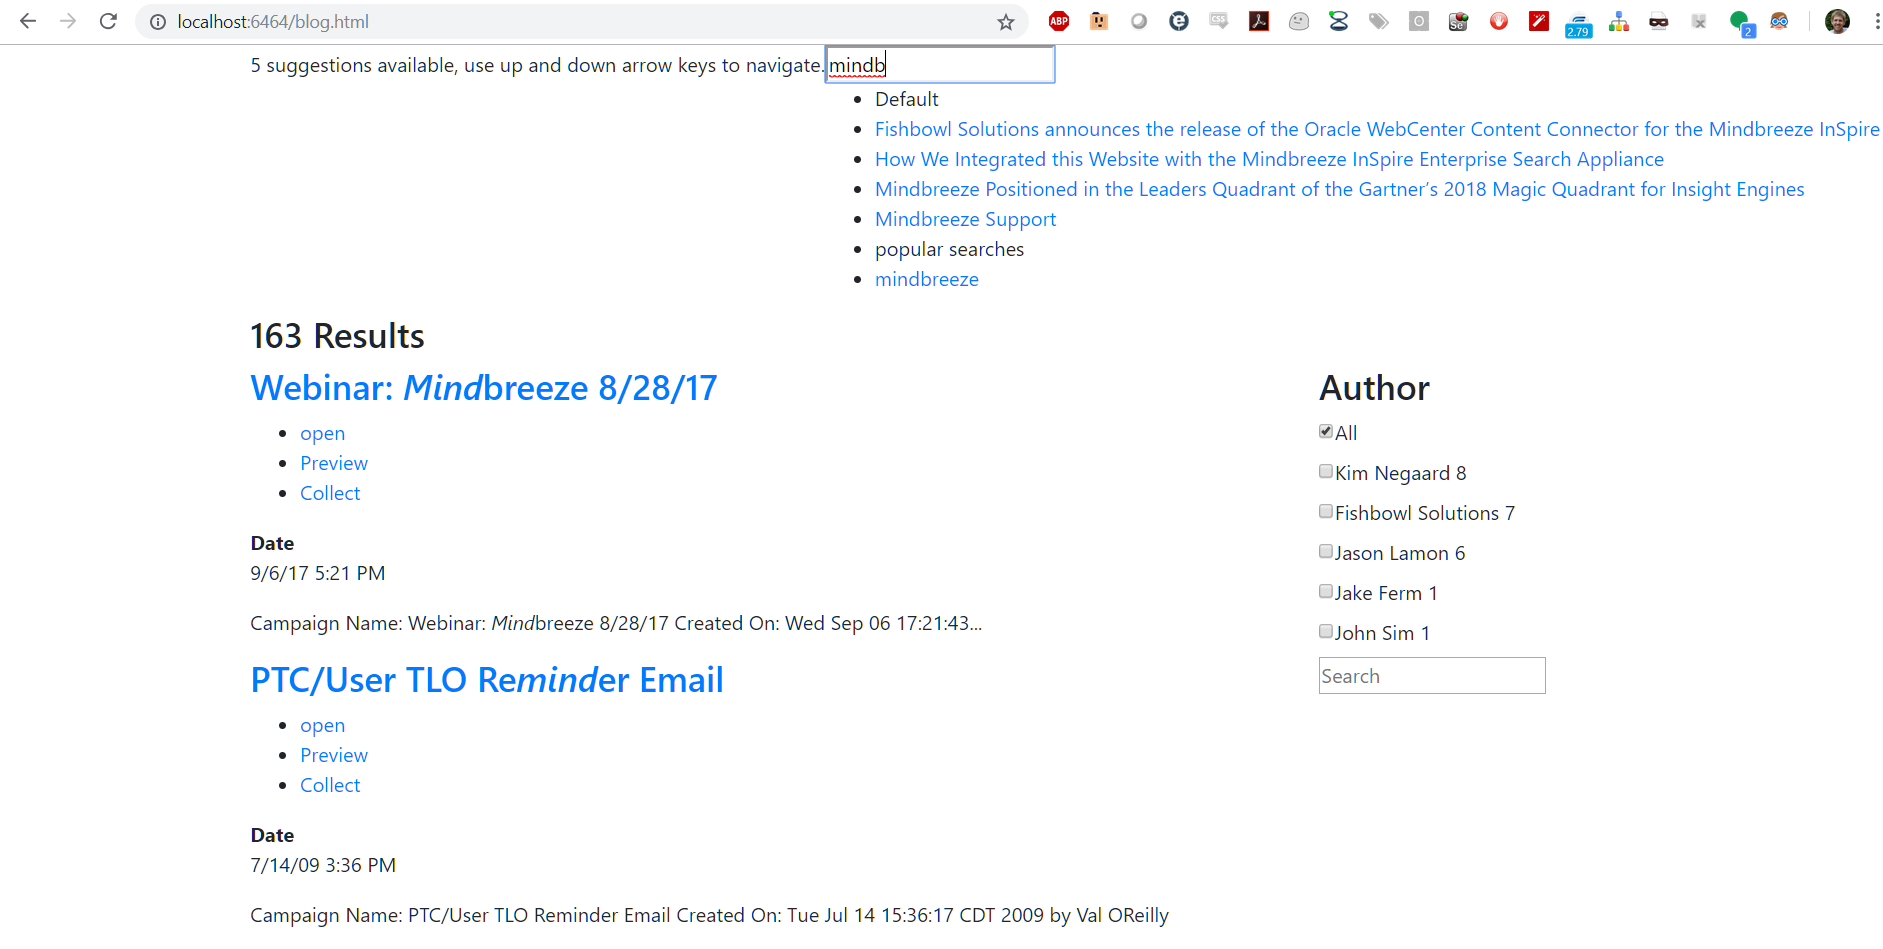
Now we want to add pagination or infinite scrolling to allow the loading of more results. For this example, I will use paging via the Mindbreeze pages tempalte. This will allow page numbers to display in list format and Mindbreeze will be able to handle the paging actions for us.
<div class="col-md-9">
          <div data-template="results">
          </div>
          <div data-template="pages">
            <script type="text/x-mustache-template" data-class-name="mypaging" data-tag-name="ul">
              {{#pages?}}
                 {{#pages}}
                    <li class="{{#current_page?}}active{{/current_page?}}"><a href="#" data-action-name="setPage" data-page="{{page}}">{{page}}</a></li>
                  {{/pages}}
              {{/pages?}}
            </script>
          </div>
        </div>
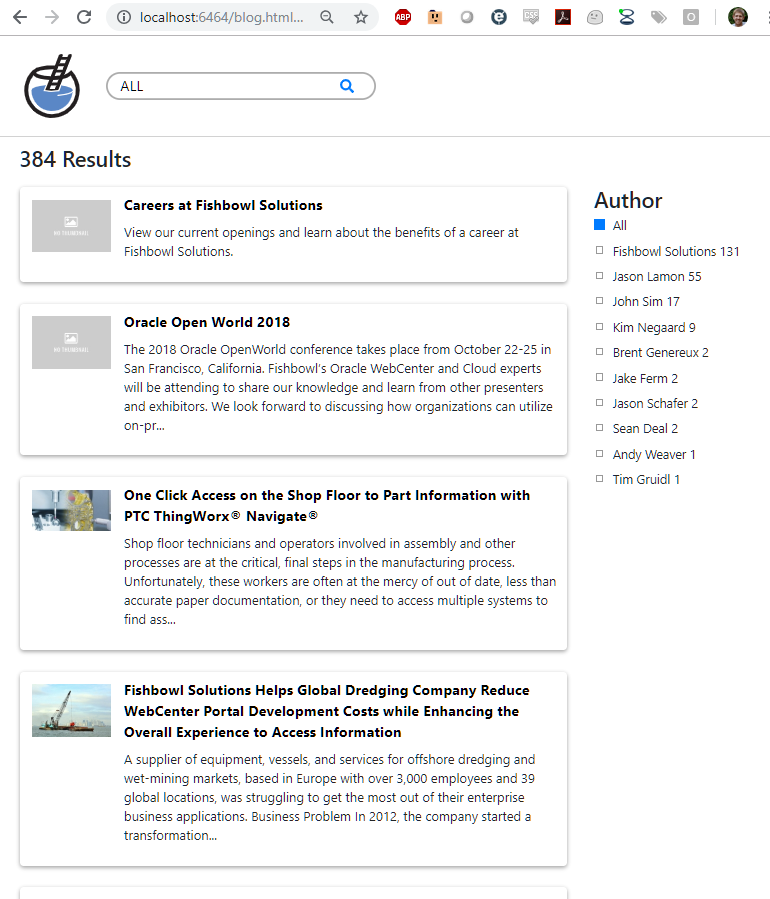
Now we want to structure our result data. This is an easy way to adjust the information displayed for each result item. We can do this by overriding our results <div> and adding our own mustache. Here is where you can make changes such as adding specific metadata for each result to display contextually relevant information.
<div data-template="results">
<script type="text/x-mustache-template" data-class-name="media mb-clickable-phone" data-attr-role="group"
data-attr-data-action-object='{ "toggleOpen": { "enabledSelector": ".visible-phone" }}'
data-attr-aria-labelledby="result_{{id}}">
<span class="pull-left media-object" aria-hidden="true">
{{#actions.data[0].value.href?}}
<a href="{{actions.data[0].value.href}}" data-disabled-selector=".visible-phone"
tabindex="-1" target="_self">{{/actions.data[0].value.href?}} {{{icon}}} {{#actions.data[0].value.href?}}
</a>{{/actions.data[0].value.href?}}
</span>
<div class="media-body">
<h3 class="media-heading" id="result_{{id}}">
{{#actions.data[0].value.href?}}
<a href="{{actions.data[0].value.href}}"
data-enabled-selector=".visible-phone" target="_self">{{/actions.data[0].value.href?}} {{{title}}} {{#actions.data[0].value.href?}}
</a>{{/actions.data[0].value.href?}}
</h3>
<ul class="mb-actions mb-separated hidden-phone mb-visible-open mb-no-print">
{{#actions.data}}
<li class="nowrap">{{{html}}}</li>{{/actions.data}}
</ul>
{{#content}}
<p class="mb-content">{{{.}}}</p>
{{/content}}
{{#mes:nested.data?}}
<ul class="mb-nested">
{{#mes:nested}}
<div class="media mb-nested" data-action-object="{ "toggleOpen": { "enabledSelector": ".visible-phone" }}">
{{#actions.data[0].value.href?}}
<a href="{{actions.data[0].value.href}}" data-disabled-selector=".visible-phone" target="_self">
{{/actions.data[0].value.href?}}
<b>{{{title}}}</b>
{{#actions.data[0].value.href?}}
</a>
{{/actions.data[0].value.href?}}
<ul class="mb-actions mb-separated hidden-phone mb-visible-submenu-open mb-no-print">
{{#actions.data}}
<li class="nowrap">
<small>{{{html}}}</small>
</li>{{/actions.data}}
</ul>
<dl class="mb-comma-separated-values mb-separated mb-summarized-description-list mb-small">
<dd>{{{mes:date}}}</dd>
</dl>
</div>
{{/mes:nested}}
</ul>
{{/mes:nested.data?}}
<span class="clearfix"></span>
</div>
</script>
</div>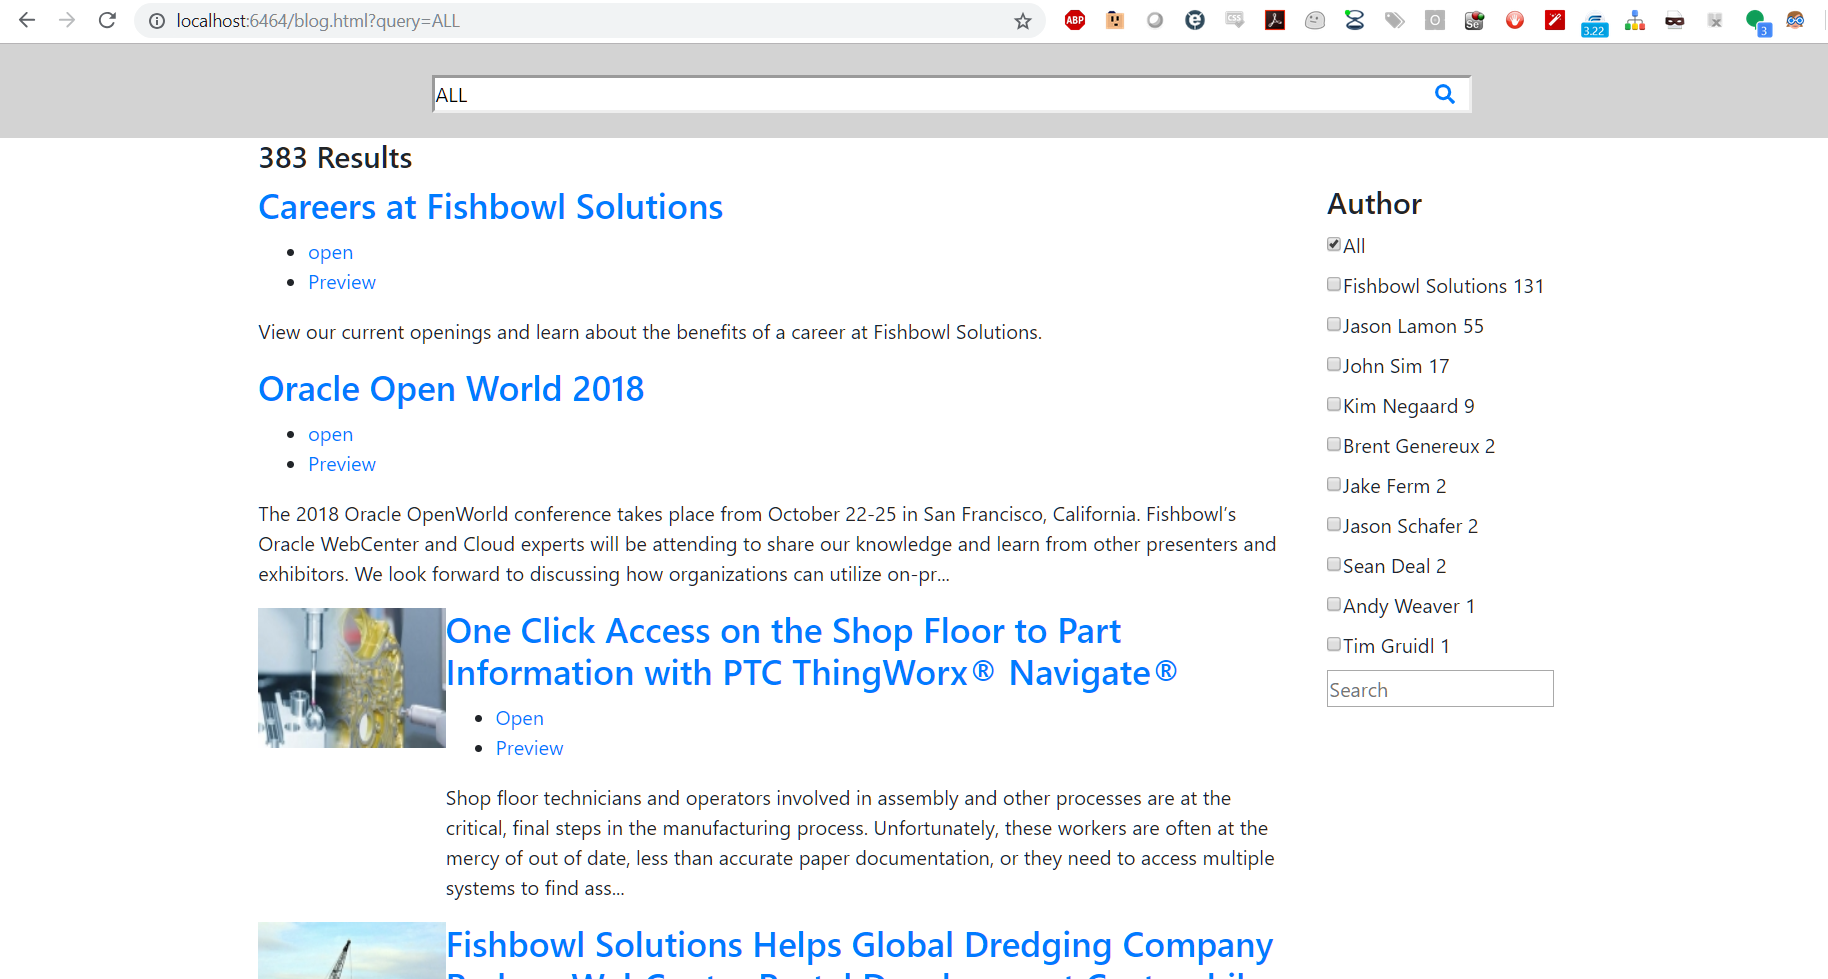
After the appropriate data is returned, we can perform some styling. For this, I am going to reference a custom CSS file on my Apache server.

We recommend that your CSS handle displaying search results on both mobile and desktop displays.
You can see the styling of the Suggestions (using jQuery UI autocomplete) below.
I’ve included the final code for this example below. You can see how this could be modified and extended to suit a wide variety of needs and use cases. If you have any questions about our experience with Mindbreeze or would like to know more, please contact us.
#searchresults {
display: flex;
flex-direction: column;
}
.header{
background: #ffffff;
}
.header .container {
display: flex;
align-items: center;
justify-content: flex-start;
max-width: 100vw;
height: 7rem;
border-bottom: 1px solid rgba(0, 0, 0, 0.2);
padding: 0;
}
.header .brand-logo {
width: 72px;
height: 72px;
padding: 0 1em;
margin: 0 0.5em;
box-sizing: content-box;
}
form{
position: relative;
margin: 0;
flex: 0 1 300px;
max-width: 300px;
padding: 0 1em;
display: flex;
flex-direction: column;
align-items: center;
height: 32px;
box-shadow: inset 0 0 0 2px #adadad;
border-radius: 1em;
transition: box-shadow 0.25s;
}
form,
form:active,
form:focus,
form:focus-within,
form input,
form input:active,
form input:focus,
form input:focus-within {
outline: none;
}
form .search-box {
display: flex;
flex-wrap: wrap;
flex-direction: row;
align-items: center;
width: 100%;
height: 100%;
}
form input{
flex: 0 0 calc(100% - 44px);
padding: 0;
border: none;
}
form:focus-within {
box-shadow: inset 0 0 0 2px #868686;
}
form .search-box button{
border: none;
padding-right: 0;
flex: 0 0 44px;
}
form .search-box .ui-autocomplete {
max-width: 300px;
width: 100% !important;
flex: 0 0 100%;
}
form span[role='status']{
display: none;
}
form ul.ui-autocomplete{
background: white;
z-index: 10;
list-style: none;
border: 1px solid black;
padding: 0;
top: 0 !important;
left: 0 !important;
}
form .ui-autocomplete-category {
background: #bdbdbd;
font-weight: 700;
}
form .ui-autocomplete li{
padding-left: 0.5em;
}
ul.ui-autocomplete span.matched{
font-weight: 700;
}
form ul a:hover{
text-decoration: none;
}
.ui-autocomplete li:hover:not(.ui-autocomplete-category) {
background: rgba(0, 0, 0, 0.1);
cursor: pointer;
}
.ui-autocomplete a{
display: block;
}
.ui-autocomplete a{
color: black;
}
.resultHeader{
font-size: 14pt;
}
.resultHeader a, .resultHeader a:hover{
text-decoration: none;
color: black;
}
div[role='status']{
padding: 10px 0px;
}
.results-wrapper {
margin: 0;
padding: 0 1.5em;
box-sizing: border-box;
flex: 0 0 100%;
max-width: 100%;
}
.results-wrapper .container {
width: 100%;
max-width: 100%;
display: flex;
flex-direction: column;
padding: 0;
}
.results-wrapper .row {
margin: 0;
display: flex;
}
.results-wrapper .results-container {
flex-direction: row;
flex-wrap: nowrap;
}
.results-wrapper .results-container .results {
padding: 0;
flex: 1 0 75%;
box-sizing: border-box;
}
.results-wrapper .row .results .results-list {
display: flex;
flex-direction: column;
}
.results-wrapper .row .results .results-list .row {
display: flex;
border-radius: 4px;
box-shadow: 0 1px 6px rgba(0,0,0,0.16), 0 2px 6px rgba(0,0,0,0.23);
transition: box-shadow 0.25s;
flex-wrap: nowrap;
}
.results-wrapper .row .results .results-list .row:hover {
box-shadow: 0 5px 20px rgba(0,0,0,0.19), 0 2px 6px rgba(0,0,0,0.23);
}
.results-wrapper .row .results .results-list .row .thumbnail {
flex: 1 0 80px;
box-sizing: border-box;
padding: 14px;
max-width: 125px;
}
.results-wrapper .results-container .filters {
flex: 0 1 25%;
box-sizing: border-box;
margin: 0 10px 0 30px;
}
.row .thumbnail a {
max-width: 100%;
}
.row .thumbnail a .mb-thumbnail {
max-width: 100%;
height: auto;
}
.results-wrapper .results-container .results .results-list .row .content {
flex: 1 0 75%;
display: flex;
flex-direction: column;
box-sizing: border-box;
padding: 0.5rem 0.5rem 0.5rem 0;
}
.row .content .resultHeader {
box-sizing: border-box;
margin-bottom: 0.5rem;
}
.row .content .resultHeader a {
font-weight: bold;
font-size: 1rem;
}
.row .content .resultHeader a:hover {
text-decoration: underline;
}
.row .content .mb-content {
font-size: 0.9rem;
}
em{
font-style: normal;
background: rgba(0, 0, 0, 0.1);
}
div[data-template='results'] .row{
margin-bottom: 1.5rem;
}
.paging {
padding: 0;
}
.paging li{
display: inline-block;
/* You can also add some margins here to make it look prettier */
zoom:1;
*display:inline;
}
.filter input[type="checkbox"] {
width: 0;
height: 0;
position: relative;
top: -6px;
margin-right: 0.8rem;
}
.filter input[type="checkbox"]:before {
position: relative;
display: block;
width: 8px;
height: 8px;
left: 2px;
top: 2px;
box-sizing: border-box;
content: "";
border: 1px solid rgba(0, 0, 0, 0.4);
background: transparent;
transition: all 0.1s linear;
cursor: pointer;
}
.filter input[type="checkbox"]:hover:before,
.filter input[type="checkbox"]:checked:before {
width: 12px;
height: 12px;
left: 0;
top: 0;
border: 0;
}
.filter input[type="checkbox"]:hover:before {
background: rgba(0, 123, 255, 0.6);
}
.filter input[type="checkbox"]:checked:before {
background: rgba(0, 123, 255, 1);
}
.paging a{
float: left;
padding: 4px 12px;
line-height: 20px;
text-decoration: none;
background-color: #fff;
border: 1px solid #b5b5b5;
border-radius: 4px;
}
.paging .disabled>span{
color: #777;
cursor: default;
background-color: transparent;
float: left;
padding: 4px 12px;
line-height: 20px;
text-decoration: none;
border: 1px solid #b5b5b5;
border-radius: 4px;
margin-right: 5px;
}
a[data-action-name='previousPage']{
margin-right: 5px;
}
.facet >div > input{
display: none;
}
.checkbox {
display: flex;
align-items: center;
margin-bottom: 1rem;
}
.checkbox > span {
font-size: 14px;
line-height: 13px;
padding-left: 8px;
}
@media screen and (max-width: 768px) {
.results-wrapper .row .results .results-list .row .thumbnail {
display: none;
}
.results-wrapper .row .results .results-list .row .content {
padding: 14px;
}
.filters {
display: none;
}
}
Index.html
<html>
<head>
<title>Mindbreeze Search</title>
<link rel="stylesheet" href="https://maxcdn.bootstrapcdn.com/bootstrap/4.0.0/css/bootstrap.min.css" integrity="sha384-Gn5384xqQ1aoWXA+058RXPxPg6fy4IWvTNh0E263XmFcJlSAwiGgFAW/dAiS6JXm"
crossorigin="anonymous">
<script src="https://code.jquery.com/jquery-3.2.1.slim.min.js" integrity="sha384-KJ3o2DKtIkvYIK3UENzmM7KCkRr/rE9/Qpg6aAZGJwFDMVNA/GpGFF93hXpG5KkN"
crossorigin="anonymous"></script>
<script src="https://cdnjs.cloudflare.com/ajax/libs/popper.js/1.12.9/umd/popper.min.js" integrity="sha384-ApNbgh9B+Y1QKtv3Rn7W3mgPxhU9K/ScQsAP7hUibX39j7fakFPskvXusvfa0b4Q"
crossorigin="anonymous"></script>
<script src="https://maxcdn.bootstrapcdn.com/bootstrap/4.0.0/js/bootstrap.min.js" integrity="sha384-JZR6Spejh4U02d8jOt6vLEHfe/JQGiRRSQQxSfFWpi1MquVdAyjUar5+76PVCmYl"
crossorigin="anonymous"></script>
<script defer src="https://use.fontawesome.com/releases/v5.0.13/js/all.js" integrity="sha384-xymdQtn1n3lH2wcu0qhcdaOpQwyoarkgLVxC/wZ5q7h9gHtxICrpcaSUfygqZGOe"
crossorigin="anonymous"></script>
<link rel="stylesheet" href="/blog.css">
</head>
<body>
<script src="https://mindbreeze.fishbowlsolutions.com:23382/apps/scripts/client.js" data-global-export="false"></script>
<script>
Mindbreeze.require(["client/application"], function (Application) {
var application = new Application({
rootEl: document.getElementById("searchresults"),
startSearch: false,
});
});
</script>
<div id="searchresults" class="">
<div class="header">
<div class="container">
<img class="brand-logo" src="/fb.svg" alt="Fishbowl Solutions">
<form class="center search-field mb-print-left" data-template="searchform" data-requires-user-input="true">
<div class="search-box">
<input data-template="suggest" data-source-id-popularsearches-title="Popular Searches" data-disabled="false"
data-placeholder="search" data-shortcut="alt+1" id="query" data-source-id-pattern="document_property|popularsearches|recent_query"
data-initial-source-id-pattern="recent_query|popularsearches" data-grouped="true" class="" name="query"
type="search" autofocus="" autocomplete="off" placeholder="Search">
<button class="btn btn-link mb-no-print" type="submit" data-i18n="[title]action_search">
<i class="fas fa-search"></i>
</button>
</div>
</form>
</div>
</div>
<div class="container results-wrapper">
<div data-template="view" data-count="5" data-constraint="ALL" class="container">
<script type="text/x-mustache-template" data-attr-role="status" data-attr-class="{{^estimated_count?}}hide{{/estimated_count?}}"
data-attr-tabindex="-1">
{{^status_messages.no_results?}}
<h4>
{{#estimated_count?}}
{{estimated_count}} {{i18n.editor_result_title}}
{{/estimated_count?}}
</h4>
{{/status_messages.no_results?}}
</script>
<div data-template="searchinfo"></div>
<div class="row results-container">
<div class="results">
<div data-template="results" class="results-list">
<script type="text/x-mustache-template" data-class-name="row" data-attr-role="group"
data-attr-data-action-object='{ "toggleOpen": { "enabledSelector": ".visible-phone" }}'
data-attr-aria-labelledby="result_{{id}}">
<span class="thumbnail" aria-hidden="true">
{{#actions.data[0].value.href?}}
<a href="{{actions.data[0].value.href}}" data-disabled-selector=".visible-phone"
tabindex="-1" target="_self">{{/actions.data[0].value.href?}}{{#icon?}} {{{icon}}}{{/icon?}}{{^icon?}} <img src="/no-thumbnail.jpg" class="mb-thumbnail"/>{{/icon?}} {{#actions.data[0].value.href?}}
</a>{{/actions.data[0].value.href?}}
</span>
<div class="content">
<div class="resultHeader" id="result_{{id}}">
{{#actions.data[0].value.href?}}
<a href="{{actions.data[0].value.href}}"
data-enabled-selector=".visible-phone" target="_self">{{/actions.data[0].value.href?}} {{{title}}} {{#actions.data[0].value.href?}}
</a>{{/actions.data[0].value.href?}}
</div>
{{#content}}
<p class="mb-content">{{{.}}}</p>
{{/content}}
{{#mes:nested.data?}}
<ul class="mb-nested">
{{#mes:nested}}
<div class="media mb-nested" data-action-object="{ "toggleOpen": { "enabledSelector": ".visible-phone" }}">
{{#actions.data[0].value.href?}}
<a href="{{actions.data[0].value.href}}" data-disabled-selector=".visible-phone" target="_self">
{{/actions.data[0].value.href?}}
<b>{{{title}}}</b>
{{#actions.data[0].value.href?}}
</a>
{{/actions.data[0].value.href?}}
<ul class="mb-actions mb-separated hidden-phone mb-visible-submenu-open mb-no-print">
{{#actions.data}}
<li class="nowrap">
<small>{{{html}}}</small>
</li>{{/actions.data}}
</ul>
<dl class="mb-comma-separated-values mb-separated mb-summarized-description-list mb-small">
<dd>{{{mes:date}}}</dd>
</dl>
</div>
{{/mes:nested}}
</ul>
{{/mes:nested.data?}}
</div>
</script>
</div>
</div>
<div class="filters">
<div data-template="filteredfacet" data-title-tag-name="h4" data-name="Author" data-container-tag-name="div"
data-container-class-name="filter" data-entry-tag-name="div"
data-entry-class-name="entry" class="facet">
</div>
</div>
</div>
<div class="row">
<div data-template="pages">
<div class="pagination">
<script type="text/x-mustache-template" data-class-name="paging" data-tag-name="ul">
{{#pages?}}
{{#onFirstPage?}}
<li class="disabled"><span>«</span><li>
{{/onFirstPage?}}
{{^onFirstPage?}}
<li><a href="#" data-action-name="previousPage">«</a><li>
{{/onFirstPage?}}
{{#pages}}
<li class="{{#current_page?}}active{{/current_page?}}"><a href="#" data-action-name="setPage" data-page="{{page_number}}">{{page}}</a></li>
{{/pages}}
{{#more_avail?}}
<li class="disabled"><span>…</span></li>
{{/more_avail?}}
{{#onLastPage?}}
<li class="disabled"><span>»</span><li>
{{/onLastPage?}}
{{^onLastPage?}}
<li><a href="#" data-action-name="nextPage">»</a><li>
{{/onLastPage?}}
{{/pages?}}
</script>
</div>
</div>
</div>
</div>
</div>
</div>
</body>
</html>
<!--
var application = new Application({
rootEl: document.getElementById("searchresults"),
startSearch: false,
queryURLParameter: "searchQuery",
});
//constraint wenn nötig
//application.setConstraint({unparsed: "extension:pdf"}); //constraint is optional
window.search = function () {
var searchQuery = document.getElementById("searchQuery").value;
//you need this only if you add the searchbox on the searchpage as well
//Now the redirect will be on the current website (window.location.href) ==> If you search on the search website the redirect should be to the searchwebsite as well.
window.location.href = "?searchQuery=" + encodeURIComponent(searchQuery);
}
function getUrlParameter(name) {
name = name.replace(/[\[]/, '\\[').replace(/[\]]/, '\\]');
var regex = new RegExp('[\\?&]' + name + '=([^&#]*)');
var results = regex.exec(location.search);
return results === null ? '' : decodeURIComponent(results[1].replace(/\+/g, ' '));
};
document.getElementById("searchQuery").value = getUrlParameter("searchQuery");
-->The post Using the Mindbreeze client.js File to Create Custom Search Interfaces appeared first on Fishbowl Solutions.
One Click Access on the Shop Floor to Part Information with PTC ThingWorx® Navigate®
Shop floor technicians and operators involved in assembly and other processes are at the critical, final steps in the manufacturing process. Unfortunately, these workers are often at the mercy of out of date, less than accurate paper documentation, or they need to access multiple systems to find associated parts information. These issues create bottlenecks that can impact quality and on time shipments, as well as lead to employee frustration.
The following is a summary of the problems Fishbowl Solutions has seen at customers when it comes to accessing parts information needed for assembly:
- Having the design engineers create manufacturing documentation, print it, and deliver physical copies to shop floor workers
- Storing associated parts information on a network drive, making it hard to find for shop floor staff but especially new workers
- Quality alerts and other processes are not integral with any systems
- Parts information contained within PDFs requires excessive scrolling to get to the information needed
- The MPMLink viewer requires multiple clicks to get to relevant parts information
To solve these problems, Fishbowl has worked with customers to leverage PTC ThingWorx to build shop floor viewing applications that can surface up relevant information to workers in one, simple view.
To read the rest of this blog post and see sample screenshots of the shop floor viewing application, please click over to the PTC LiveWorx 2019 blog.
The post One Click Access on the Shop Floor to Part Information with PTC ThingWorx® Navigate® appeared first on Fishbowl Solutions.
Fishbowl Solutions Helps Global Dredging Company Reduce WebCenter Portal Development Costs while Enhancing the Overall Experience to Access Information
A supplier of equipment, vessels, and services for offshore dredging and wet-mining markets, based in Europe with over 3,000 employees and 39 global locations, was struggling to get the most out of their enterprise business applications.
Business ProblemIn 2012, the company started a transformation initiative, and as part of the project, they replaced most of their enterprise business applications. The company had over 10 different business applications and wanted to provide employees with access to information through a single web experience or portal view. For example, the field engineers may need information for a ship’s parts from the PLM system (TeamCenter), as well as customer-specific cost information for parts from the company’s ERP system (IFS Applications). It was critical to the business that employees could quickly navigate, search, and view information regardless of where it is stored in the content management system. The company’s business is built from ships dredging, laying cable, etc., so the sooner field engineers are able to find information on servicing a broken part, the sooner the company is able to drive revenue.
Integrating Oracle WebCenterThe company chose Oracle WebCenter Portal because it had the best capabilities to integrate their various business systems, as well as its ability to scale. WebCenter enabled them to build a data integration portal that provided a single pane of glass to all enterprise information. Unfortunately, this single pane of glass did not perform as well as expected. The integrations, menu navigation, and the ability to render part drawings in the portal were all developed using Oracle Application Development Framework (Oracle ADF). Oracle ADF is great for serving up content to WebCenter Portal using taskflows, but it requires a specialized development skill set. The company had limited Oracle ADF development resources, so each time a change or update was requested for the portal it took them weeks and sometimes months to implement the enhancement. Additionally, every change to the portal required a restart and these took in excess of forty minutes.
Platform GoalsThe company wanted to shorten the time-to-market for portal changes, as well as reduce its dependency on and the overall development and design limitations with Oracle ADF. They wanted to modernize their portal and leverage a more designer-friendly, front-end development framework. They contacted Fishbowl Solutions after searching for Oracle WebCenter Portal partners and finding out about their single page application approach (SPA) to front-end portal development.
Fishbowl Solutions’ SPA for Oracle WebCenter Portal is a framework that overhauls the Oracle ADF UI with Oracle JET (JavaScript Extension Toolkit) or other front-end design technology such as Angular or React. The SPA framework includes components (taskflows) that act as progressive web applications and can be dropped onto pages from the portal resource catalog, meaning that no Oracle ADF development is necessary. Fishbowl’s SPA also enables portal components to be rendered on the client side with a single page load. This decreases the amount of processing being done on the portal application server, as well as how many times the page has to reload. This all leads to an improved experience for the user, as well as the ability design and development teams to view changes or updates to the portal almost instantaneously.
OutcomeFishbowl Solutions helped the company implement its SPA framework in under two weeks. Since the implementation, they have observed more return visits to the portal, as well as fewer support issues. They are also no longer constrained by the 40-minute portal restart after changes to the portal, and overall portal downtime has been significantly reduced. Lastly, Fishbowl’s SPA framework provided them with a go-forward design and development approach for portal projects, which will enable them to continue to evolve their portal to best serve their employees and customers alike.
The post Fishbowl Solutions Helps Global Dredging Company Reduce WebCenter Portal Development Costs while Enhancing the Overall Experience to Access Information appeared first on Fishbowl Solutions.
Four Options for Creating Mindbreeze Search Interfaces
A well-designed search interface is a critical component of an engaging search experience. Mindbreeze provides a nice combination of both pre-built search apps and tools for customization. This post explores the following approaches to building a Mindbreeze search interface:
- The Mindbreeze Default Search Client
- The Mindbreeze Search App Designer
- Custom Mindbreeze Web Applications
- The Mindbreeze REST API
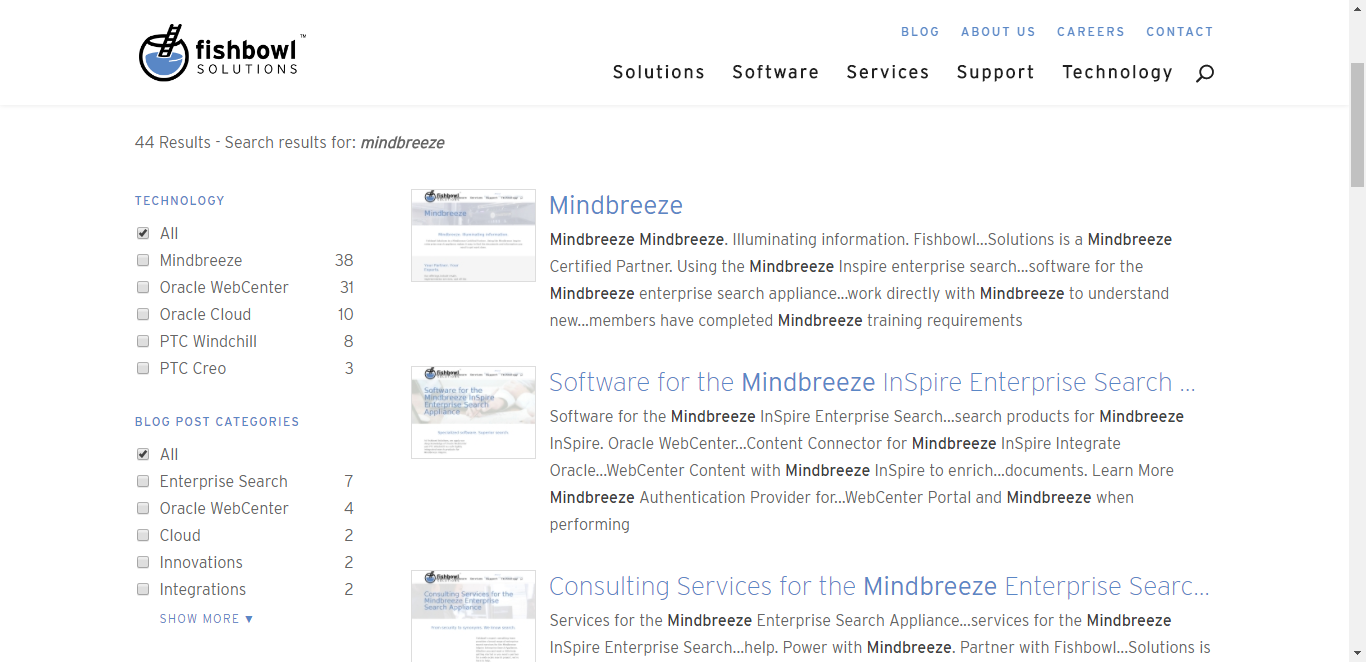
Mindbreeze includes a built-in search client which offers a feature-rich, mobile friendly, search interface out of the box. Built-in controls exist to configure filter facets, define suggestion sources, and enable or disable export. Features are enabled and disabled via the Client Service configuration interface within the Mindbreeze Management Center. The metadata displayed within the default client is determined by the value of the “visible” property set in the Category Descriptor for the respective data sources. Some of the Mindbreeze features exposed through the default client are not available via a designer-built search app (discussed in Option 2). These include saved searches, result groupings (i.e. summarize-by), the sort-by picker, sources filters, and tabs. Organizations that wish to use these features without much effort would be wise to consider the Mindbreeze Default Search Client.
In order to integrate the built-in client with a website or application, users are typically redirected from the primary website to the Mindbreeze client when performing a search. The default client is served directly from the search appliance and the query term can be passed in the URL from the website’s search box to the Mindbreeze client. Alternately, the built-in client can be embedded directly into a website using an iframe.
Mindbreeze uses an XML file called the Category Descriptor (categorydescriptor.xml) to control various aspects of both indexing and serving for each data source category (e.g. Web, SharePoint, Google Drive, etc.). Each category plugin includes a default Category Descriptor which can be extended or modified to meet your needs. Common modifications include adding localized display labels for metadata field names, boosting the overall impact of a metadata field on relevancy, and changing which fields are visible within the default search client.
The Mindbreeze Search App Designer provides a drag-and-drop interface for creating modular, mobile-friendly, search applications. Some of the most popular modules include filters, maps, charts, and galleries. Many of these features are not enabled on the aforementioned default Client, so a search app is the easiest way to use them. This drag-and-drop configuration allows for layout adjustments, widget selection, and basic configurations without coding or technical knowledge. To further customize search apps, users can modify the mustache templates that control the rendering of each search widget within the search app. Common modifications include conditionally adjusting visible metadata, removing actions, or adding custom callouts or icons for certain result types.
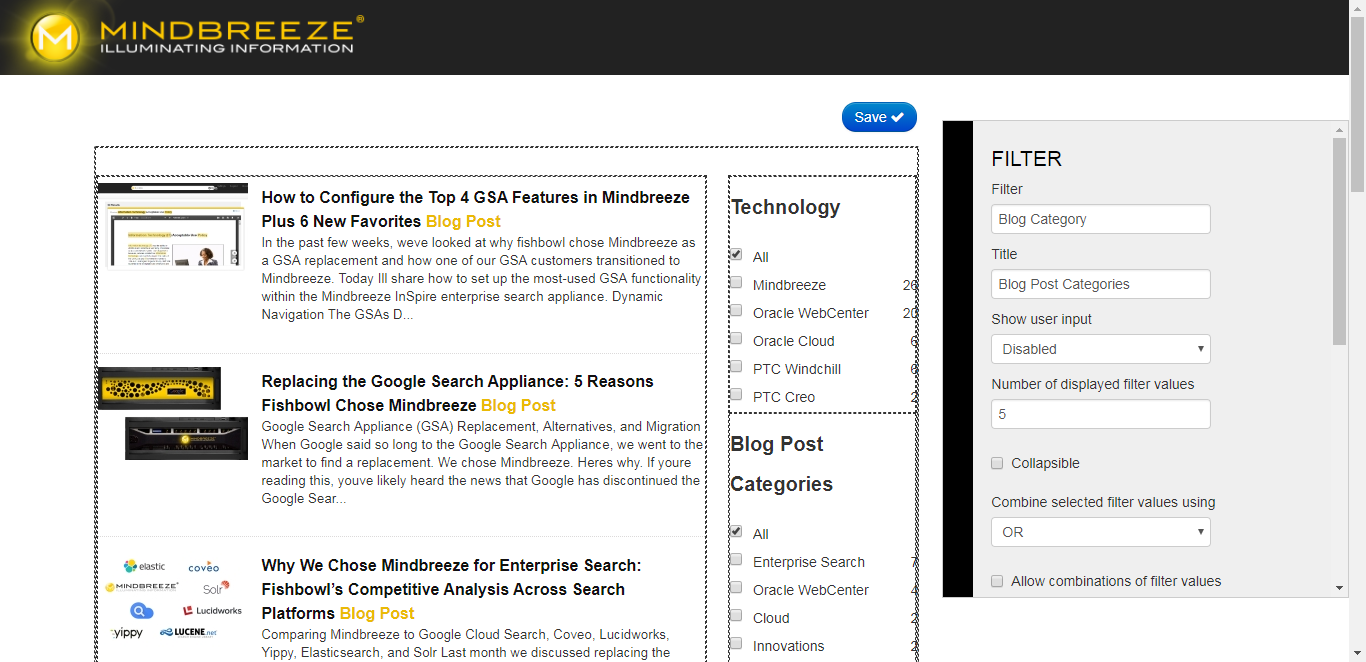
A key feature is the ability to export the code needed to embed a search app into a website or application from the Search Apps page in the Mindbreeze Management Center. That code can then be placed directly in a div or iframe on the target website eliminating the need to redirect users to the appliance. Custom CSS files may be used to style the results to match the rest of the website. Although you can add a search box directly to a search app, webpages usually have their own search box in the header. You can utilize query terms from an existing search box by passing them as a URL parameter where they will be picked up by the embedded search app.
Did you know? This website uses a search app for Mindbreeze-powered website search. For a deep-dive look at that integration, check out our blog post on How We Integrated this Website with Mindbreeze InSpire.
The default client mentioned in Option 1 can also be copied to create a new custom version of a Mindbreeze Web Application. The most common alteration is to add a reference to a custom CSS file which modifies the look and feel of the search results without changing the underlying data or DOM structure. This modification is easy and low risk. It also very easy to isolate issues related to such a change, as you can always attempt to reproduce an issue using the default client without your custom CSS.
More substantial modifications to the applications index.html or JavaScript files can also be made to significantly customize and alter the behavior of the search experience. Examples include adding custom business logic to manipulate search constraints or applying dynamic boosting to alter relevancy at search time. Other Mindbreeze UI elements can also be added to customized web apps using Mindbreeze HTML building blocks; this includes many of the elements exposed through the search app Designer such as graphs, maps, and timelines. While these types of alterations require deeper technical knowledge than simply adding custom CSS, they are still often less effort than building a custom UI from scratch (as described in Option 4). These changes may require refactoring to be compatible with future versions or integrate new features over time, so this should be considered when implementing your results page.
Option 4: The Mindbreeze REST API Flexibility: High | Development Effort: Moderate to HighFor customers seeking a more customized integration, the Mindbreeze REST API allows search results to be returned as JSON, giving you full control over their presentation. Custom search pages also allow for dynamic alterations to the query, constraints, or other parameters based on custom business logic. Filters, spelling suggestions, preview URLs, and other Mindbreeze features are all available in the JSON response, but it is up to the front-end developers to determine which features to render on the page, how to arrange them, and what styling to use. This approach allows for the most control and tightest integration with the containing site, but it is also the most effort. That said, just because custom search pages generally require the greatest effort is not to say selecting this option always will result in a lengthy deployment. In fact, one of our clients used the Mindbreeze API to power their custom search page and went from racking to go-live in 37 days.
—
Mindbreeze offers an excellent combination of built-in features with tools for extending capabilities when necessary. If you have any questions about our experience with Mindbreeze or would like to know more, please contact us.
The post Four Options for Creating Mindbreeze Search Interfaces appeared first on Fishbowl Solutions.
Fishbowl Solutions Leverages Oracle WebCenter to Create Enterprise Employee Portal Solution for National Insurance Company
An insurance company that specializes in business insurance and risk management services for select industries was struggling to provide their 2,300 employees with an employee portal system that kept users engaged and informed. They desired to provide their employees with a much more modern employee portal that leveraged the latest web technologies while making it easier for business users to contribute content. With the ability for business stakeholders to own and manage content on the site, the company believed the new portal would be updated more frequently, which would make it stickier and keep users coming back.
Business ObjectiveThe company had old intranet infrastructure that included 28 Oracle Site Studio Sites. The process for the company’s various business units to contribute content to the site basically involved emailing Word documents to the company’s IT department. IT would then get them checked into their old WebCenter Content system that supported the SiteStudio system. Once the documents were converted to a web-viewable format, it would appear on the site. Since IT did not have a dedicated administrator for the portal, change requests typically took days and sometimes even weeks. With the company’s rapid growth, disseminating information to employees quickly and effectively became a priority. The employee portal was seen as the single place where employees could access company, department and role-specific information – on their desktop or mobile device. The company needed a new portal solution backed by strong content management capabilities to make this possible. Furthermore, Oracle Site Studio was being sunsetted, so the company needed to move off an old and unsupported system and onto a modern portal platform that had a development roadmap to support their business needs now and into the future. The company chose Oracle WebCenter Content and Portal 12c as this new system.
The company’s goals for the new employee portal were:
- Expand what the business can do without IT involvement
- Better engage and inform employees
- Less manual, more dynamic portal content
- Improve overall portal usability
- Smart navigation – filter menus by department and role
- Mobile access
Because of several differentiators and experience, the insurance company chose Fishbowl Solutions to help them meet their goals. The company really liked that Fishbowl offered a packaged solution that they felt would enable them to go to market faster with their new portal. Effectively, the company was looking for a portal framework that included the majority of what they needed – navigation, page templates, taskflows, etc. – that could be achieved with less coding and more configuration. This solution is called Portal Solution Accelerator.
Oracle WebCenter Paired with Fishbowl’s Portal Solution AcceleratorAfter working together to evaluate the problems, goals, strategy, and timeline, Fishbowl created a plan to help them create their desired Portal. Fishbowl offered software and services for rapid deployment and portal set up by user experience and content integration. Fishbowl upgraded the company’s portal from SiteStudio to Oracle WebCenter Portal and Content 12c. Fishbowl’s Portal Solution Accelerator includes portal and content bundles consisting of a collection of code, pages, assets, content and templates. PSA also offers content integration, single-page application (SPA) task flows, and built-in personalization. These foundational benefits for the portal resulted in a reduction in time-to-market, speed and performance, and developer-friendly design.
ResultsAfter implementing the new Portal and various changes, the content publishing time was reduced by 90 percent as the changes and updates now occur in hours instead of days or weeks, which encourages users to publish content. The new Framework allows for new portals to be created with little work from IT. Additionally, the in-place editor makes it easy for business users to edit their content and see changes in real-time. Role-based contribution and system-managed workflows streamline to content governance. The new mega-menu provided by the SPA provides faster, more intuitive navigation to intranet content. This navigation is overlaid with Google Search integration, further ensuring that users can find the content they need. Most of the components used in the intranet are reusable and easy to modify for unique cases. Therefore, the company can stay up-to-date with minimal effort. Finally, the Portal has phone, tablet, and desktop support making the intranet more accessible, ensuring repeat visits.
Overall, the national insurance company has seen an immense change in content publishing time reduction, ease of editing content, and managing and governing the portal since working with Fishbowl. The solutions that Fishbowl created and implemented helped decrease weekly internal support calls from twenty to one.
The post Fishbowl Solutions Leverages Oracle WebCenter to Create Enterprise Employee Portal Solution for National Insurance Company appeared first on Fishbowl Solutions.
Fishbowl Solutions’ ControlCenter Drives Down Project-Related Costs by $400,000 for National Builder and Real Estate Management Company
A large builder, developer, and real estate management company with over 600 million employees and $1 billion in revenue reached out to Fishbowl Solutions for help with their employee onboarding and project-related content management processes.
Approximately eight percent of their employees were projected to retire by 2020, 43 percent of new hires were under the age of 35, and 41 percent of the workforce had less than two years tenure. The salary cost to onboard a new hire nearly tripled after an employee left. Additionally, the average cost of reinventing projects was $16,000 while the average cost of estimating with incorrect rates was $25,000. All these factors were causing the company’s project initiation/startup costs to be much higher than expected leading to less profit.
Business ObjectiveThe company was in search of a solution to streamline their onboarding process and provide easier access to content overall. Their documents were scattered across file shares, Oracle WebCenter Content, and SharePoint— not including the multiple regional offices and departments with their own copies of documents. Therefore, there were multiple versions of content, outdated content, and no reviews or ownership of content across the company. Due to the unorganized content management, the company had no connection between project-specific content and the master documents. The manuals were tedious to assemble and constantly out of date.
Inevitably, the company decided to change their content management system to accommodate the changing corporate landscape. They wanted to achieve financial value with their content management processes, as well as support their strategic goals such as mitigate risk, create a competitive advantage, and improve customer focus.
The desired capabilities of their new content management system were:
- Browse menu for structured navigation
- Google search for keyword searches
- Structure search pages for advanced search
- Visual navigation based on their lifecycle framework
The real estate company chose to work with Fishbowl Solutions because of their WebCenter Content Consulting services experience and expertise. WebCenter was an existing technology investment for the company, but also provided advantages for their content management goals. WebCenter boasts flexible metadata and document profiles, as well as robust version control. Additionally, there is a tiered security, flexible workflow engine, and integration with other applications such as JD Edwards. The other reason the company chose Fishbowl was because of its ControlCenter product. ControlCenter is an all-in-one solution for ensuring compliance with regulatory standards and automating document control. It has a dedicated user interface and extends the functionality of WebCenter with document control, knowledge management, compliance and audibility.
After consulting the company on their existing situation and goals, Fishbowl implemented ControlCenter with Oracle WebCenter Content for the employees to manage, maintain, and share corporate knowledge, assembled manuals, and real estate archives. ControlCenter provided a modern, mobile-ready interface which included search, retrieval, and document control capabilities. It also offers a role-aware interface, including a dashboard for documents requiring attention which would be driven by workflow review notifications. Additionally, the interface enabled relevant content to be located based on the phase of a project (i.e. preconstruction) and the project member role (i.e. developer); therefore, the employees have relevant, necessary information for their positions. The system was also integrated Oracle JD Edwards to sync lease information as lease agreements were kicked off in ControlCenter.
ResultsWith the implementation in place, the new ControlCenter platform made it easier to train the general user (approximately five to 10 minutes) and decreased onboarding cost per employee by two times because of better process documentation, knowledge sharing, and mobile access. With that, less time is now spent on training and onboarding. ControlCenter also ensures compliance through a schedule review process and the highest degree of content and metadata accuracy. Content owners are now aware of out-of-date information and data and users can easily find the content anytime and anywhere on both desktop and mobile devices. In addition to creating a more effective workspace, Fishbowl helped reduce project startup costs by $400,000 through the reduction of duplicated work.
The post Fishbowl Solutions’ ControlCenter Drives Down Project-Related Costs by $400,000 for National Builder and Real Estate Management Company appeared first on Fishbowl Solutions.
Chatbot Tech Round Table: Three Real Life Use Cases on How Oracle Chatbots Can Be Integrated into Cloud Applications
Chatbots are increasingly becoming an excellent tool for organizations to consider when developing their user experience. They provide a fast and engaging way for users to access information more efficiently. In this video, you will learn just a few ways of how chatbots can be used by being integrated into cloud applications. Fishbowl’s John Sim, an Oracle Ace, demonstrates three different scenarios in which chatbots can improve the user experience for an account manager.
What You’ll See:
- The day in the life of an account manager onsite with a customer using a chatbot
- How chatbots make onboarding more efficient by providing new sales reps with interactive training
- How chatbots enhance an account managers ability to engage with a customer with knowledge from the Oracle mobile cloud
To get even more information about chatbots and how you can better utilize their capabilities, please contact us directly at info@fishbowlsolutions.com or visit our chatbot consulting page.
The post Chatbot Tech Round Table: Three Real Life Use Cases on How Oracle Chatbots Can Be Integrated into Cloud Applications appeared first on Fishbowl Solutions.
Fishbowl Solutions Helps Global Communications Company Leverage Oracle WebCenter to Create a Consumer-Grade Portal Experience for its Employees
An international communications, media, and automotive company based in the United States, with over $18 billion in revenue 60,000 employees globally, wanted to implement a new, consumer-grade portal to provide a digital workplace where employees can access company-wide information, as well as share tools and resources.
Business ObjectiveThe company was challenged with having to manage and maintain four different portals across their divisions. Each of these had its own set of features including separate collaboration systems, design that did not comply with the company’s current branding and style guidelines, and ten-year old portal technology that was no longer supported.
Overall, the company envisioned a single portal to engage employees as ambassadors and customers by surfacing news about products and key initiatives. Additionally, provide employees with a broader knowledge of the entire company beyond their divisions. In considering this vision, the company outlined their objectives:
- Connect and engage employees by providing them with easy access to company, department news, resources and tools
- Improve user experience (UX) design and content restructuring of employee information systems
- Enhance and increase employee collaboration
After evaluating several enterprise portal platforms, the company chose Oracle WebCenter as the system they would use to build their employee digital workplace portal. Oracle WebCenter includes content management and portal components. It was particularly chosen due to its scalability and performance (backed by Oracle database), its ability to target and personalize content based on metadata, its flexibility to provide integrations with third-party collaboration systems, and its ability to integrate with Oracle applications including E-Business Suite, PeopleSoft, and Taleo Cloud Service.
The company had limited Oracle WebCenter development and implementation experience and resources, so they sought out partners to help with their new portal implementation. Fishbowl Solutions was chosen based on their vast Oracle WebCenter experience and expertise. Additionally, Fishbowl offered a portal jumpstart framework called Portal Solution Accelerator (PSA) that provided additional software capabilities to drive better user experience and overall performance. This includes integrating content to be consumed on the portal using single page applications (SPA) instead of Oracle Application Development Framework (ADF) taskflows. SPA taskflows are more lightweight and can therefore be more easily consumed on the portal without impacting performance. SPA taskflows also enable the use of other front-end design frameworks, such as Oracle JET (JavaScript Extension Toolkit), enabling web designers and marketers to develop their own components with basic Javascript, HTML, and CSS knowledge.
Fishbowl Solutions leveraged its PSA to address seven critical capabilities the company wanted from the new portal:
- Hybrid Content Integration – Ability to make quick updates/edits to content on the portal portal via a web inline editor, while having new content be checked in via profiles using Oracle WebCenter Content
- Personlization – Content targeted to individuals based on such user attributes as Division, Department, Company, Loacation, Management, and Employee Type
- Security – Leveraged roles and groups from Oracle Unified Directory to drive security. Fishbowl’s Advanced User Security Mapping (AUSM) software was used to ease user management because it enables rules to be created to map LDAP attributes to WebCenter roles (participant, contributor, administrator, etc.)
- Collaboration – Integrated 3rd-party collaboration system, Jive, into the portal user experience so that users can see activity stream and collaborate with others in-context of the portal
- Application Integration – Integrated with PeopleSoft Human Capital Management to pull additional employee data onto the portal. This was needed for upper management to be able to quickly view HR-related tasks on mobile devices.
- Content & People Search – Content indexed by the Google Search Appliance is made available by searching on the portal where secure results are returned
- Optimal Portal Performance – Leveraged local Oracle Coherence cache available per node in WebCenter Portal, while Redis was used as a means to create a central publishing model for updated content to the cache
 The company officially launched the new employee portal in July of 2017. Since then, user feedback has been very positive. The value-add capabilities of Fishbowl PSA – standard portal page templates and layouts, mega-menu navigation, role-based content contribution using Oracle WebCenter Content – meant the company could focus on implementation and not custom development. This reduced time-to-market by 25 percent. Typically, the company has around 1,500 concurrent users on the home page, which loads in about 4.5 seconds. Secondary page visits take around 2.5 seconds to load. This performance is easily tracked as the company sees around 40,000 active users each week with minimal complaints or issues reported. The load times have exceeded expectations.
It has been reported that 92 percent of user sessions occur from the desktop, 5 percent from smartphones, and 2 percent from tablets. The most popular portal page is the Home page, followed by Time Reporting, Jobs, My Pay, and Employee Discounts.
Overall, the new portal has provided employees with a broader knowledge of the entire company beyond their position, division, and department, while bringing together one unified message and brand.
The post Fishbowl Solutions Helps Global Communications Company Leverage Oracle WebCenter to Create a Consumer-Grade Portal Experience for its Employees appeared first on Fishbowl Solutions.
A Simple, Straightforward Method to Update Content on WebCenter-Based Portal Pages
In our experience working with numerous WebCenter Portal customers, almost all of whom suffered from failed portal/intranet implementations, this difficulty to update and quickly edit page content always lead to stagnant content throughout the portal. This stagnant content made the portal less sticky and therefore the organization didn’t realize widespread adoption.
The difficulty to add and update content was magnified by the fact that in most cases, portal page updates were performed by system administrators. As you can imagine especially in a large organization, the ability for a few admins making page updates across human resources, finance, marketing, and IT departments would cause bottlenecks and it would be days or weeks before the various business groups would see their new content on the portal. Because the business groups really couldn’t take ownership of the content on the portal, less and less changes or updates would be requested.
To make it easier for customers to update their portals and ultimately realize distributed content authoring, Fishbowl Solutions released its Portal Solution Accelerator (PSA) framework in 2012 which included a profile-driven process to make page updates. Today, one of the most desirable and usable features of Fishbowl’s Portal Solution Accelerator (PSA) is the inline editor. This feature enables portal users with the appropriate permissions to edit content directly on portal pages. Now before I provide more detail on this feature, I think it is important to provide some context on how Fishbowl Solutions has continued to make this feature easier for the business user to edit content.
With previous versions of PSA, the process involved the user going to the content server to find the content item. They then would check out the item, and then use a WYSIWYG-style editor to edit the content. After checking the content item back in they would return to the portal, refresh the page, and hopefully see the changes they made. To highlight what I’ve outlined above, see this video starting at 44:48.
With the current version of PSA, the inline editor was built with the business user mind. Fishbowl wanted to ensure that anyone with the appropriate permissions could edit page content and that the process itself could be done directly on the page itself. This would ensure that more users across more departments could be involved with keeping content on the portal fresh and new, helping companies get more value through higher adoption. An overview of the process is as follows:
- Users with the appropriate permissions go to the page they want to update. Hover effects indicate highlighted sections that can be updated.
- They then click on the edit icon (pencil on paper) that will appear in the bottom right corner of the editable section.
- Once clicked, stylized versions of Content Server profile pages appear. Within this profile form, the user can make any changes to page content. At this point, this page (content item) is checked out from the content server.
- Once finished the user click out of the profile form. This checks the item back in, which could trigger a workflow process for page reviews. The user that did the editing can then see in near real-time the updates to the page they made.
To illustrate how easy it is to edit portal page content with Fishbowl’s PSA inline editor, this video shows some examples of editing content, approving those items through workflow, and then seeing the updates.
As you can see, the inline editor feature of Fishbowl’s PSA makes it easy for anyone to update content on the portal. This feature alone ensures that more people within an organization, across departments and roles, can participate in content creation. With content being created more frequently, employees should be more engaged and better informed leading to higher rates of portal adoption.
The post A Simple, Straightforward Method to Update Content on WebCenter-Based Portal Pages appeared first on Fishbowl Solutions.
The Intelligent Chatbot to Customer Service Agent Hand-Off within Zendesk
Chatbots are on the rise. By 2020, over 80% of businesses are expected to implement some type of chatbot automation (Business Insider, 2016). This type of automation is inevitable due to the amount of time and money that chatbots can save a business. However, especially in the early days of the chatbot revolution, a bot will not be able to solve all the problems that a human can. One specific use case for chatbots that we have examined is customer support. Customer support bots can reduce the workload of support staff by a great deal, but some customers will not find the support they need with a bot. Wouldn’t it be great if a customer could seamlessly go from talking to a bot to a live person in the same interface? That is exactly what we created at Fishbowl and you can see in this video.
Starting a conversation with this bot begins using Oracle’s chatbot framework, a feature of Oracle Mobile Cloud Service, much like the rest of our bots. It has the capability do all the integrations that our other bots have with systems such as Salesforce, Oracle Engagement Cloud, and Zendesk Software and Support ticketing system. However, this bot has the ability to connect to Zendesk’s live chat service for more personal support from a live agent. Using the bot, information is collected to be passed to the live agent, so that the live agent can know what was already asked and can waste no time in helping the customer.
To move from a bot conversation to a live chat conversation and back again, customizations had to be made to our web client. Since the live chat feature in Oracle’s bot framework is still a work in progress, the best solution was to stop sending messages to the bot after the user goes through the “connect to a live agent” chat flow. Instead, the web client sends messages directly to Zendesk and receives them in turn. Once the conversation has concluded, the bot returns to normal and talks to the bot framework once again.
Customer service is a critical component of the overall customer experience, and getting customers answers to common questions can go a long way to ensure brand loyalty. Some stats suggest that 80% of routine questions can be answered by a chatbot, but when an agent is needed it is important to provide a seamless handoff while providing the agent with context to immediately begin servicing the customer. If integrated correctly, chatbots and customer service/support representatives (agents) can together improve the customer service experience.
You can see more of the intelligent chatbots Fishbowl has created using Oracle Mobile Cloud here: https://www.fishbowlsolutions.com/oracle-intelligent-chatbot-cloud-service-consulting/
The post The Intelligent Chatbot to Customer Service Agent Hand-Off within Zendesk appeared first on Fishbowl Solutions.
Collaborate Preview #2: Consider your Options for Moving Oracle WebCenter to the Cloud
By now, most people have heard about the benefits of cloud computing. To summarize, the cloud promises more agility and scalability, with less cost and administration. However, for legacy customers using on-premise software, getting to the cloud isn’t always a simple and straightforward process. In fact, a lot of times confusion on deployment options, pricing, customer-managed versus vendor-managed, and security may delay cloud strategies. This is definitely the case for Oracle WebCenter Content customers who have a myriad of options to move their documents, images, and other enterprise content to the cloud.
Fortunately for Oracle WebCenter customers, Oracle offers the most complete set of cloud services spanning Platform as a Service (PaaS) and Infrastructure as a Service (IaaS). With this set of cloud services, Oracle WebCenter Content customers have industry-leading options to deploy their WebCenter instances to the cloud. Here is a summary of those options:

- Public cloud with granular control of security
- Computing, block storage, networking services
- Customer administered
- Bring WebCenter licenses
- Administration: High, user-owned

- Computing, block storage, networking services
- Bring WebCenter licenses
- Administration: High, user-owned

- Full operating environment including WebLogic
- Complete control and customization
- Bring WebCenter licenses
- Administration: Moderate to low

- WebCenter Portal in the Cloud
- Metered or non-metered licenses
- Administration: Moderate to low
You might be surprised that Oracle WebCenter Portal Cloud Service is listed above as one of the options to move Oracle WebCenter Content to, but it does present a viable solution. The user experience has always been one of the biggest complaints with WebCenter Content. Moving your content to the cloud and using WebCenter Portal Cloud to create intranets, extranets, composite applications, self-service portals and user experiences to access content could ensure a better user experience overall, and ensure more adoption going forward. It provides users a more secure and efficient means to consume information while being able to also interact with applications, processes, and other users. The added benefit is that it comes with Oracle WebCenter Content.
We will be discussing more about the options WebCenter Content and Portal customers have to move their on-premise instances to the Oracle Cloud at Collaborate 2018 during this session: Options and Considerations for Moving Oracle WebCenter Content & Portal to the Cloud, which takes place on Monday, April 23rd from 11:00 AM to 12:00 PM. In this session, Fishbowl’s Director of Solutions, Jerry Aber, will go into more detail about the Oracle Cloud options listed above, as well as what to expect from a pricing perspective. Come hear about considerations for hybrid cloud environments as well, and what that means from an Oracle Cloud architecture perspective.
For more information on all of Fishbowl’s activities at Collaborate 2018, please visit this page: https://www.fishbowlsolutions.com/about/news/collaborate/
The post Collaborate Preview #2: Consider your Options for Moving Oracle WebCenter to the Cloud appeared first on Fishbowl Solutions.
Collaborate Preview #1: How a Chatbot Army Could Help Your Business
No matter your profession, having an assistant to provide some help would be awesome. Someone to compile data, run reports, enter information into systems, look up key details, and even order your new business cards after your promotion. Unfortunately, most professionals don’t have an actual human assistant to perform tasks like these specifically for them. Most of these tasks we all do ourselves, and while they all may be important and necessary, they take time away from more value-add tasks and those parts of your job you really enjoy.
Sales professionals, for example, all have a multitude of tasks they need to perform that actually gets them to their desired result: making the sale. They need to update their customer relationship management (CRM) system daily with new or edited opportunities, new contacts, notes from customer calls, and what their activities or tasks will be for the day. Not only are these updates important for each and every sales representative, but they are also critical for sales managers who need to review pipeline and forecast information and share it with executive or leadership teams. And while performing these updates or accessing sales data may only take about 15 minutes, if they are performed every business day over 1 year, sales reps stand to lose about 2 selling days. Multiply that number by how many sales reps your company employs, and we’re talking 15, 20 or even 30 selling days lost in a year.
Another example is the questions employees have regarding company policies and procedures, as well as the small issues they might encounter every day. Even the best employee onboarding and training programs are not going to help all employees remember vacation policies, or how to change insurance beneficiaries, or what to do if they need to reset a password. When faced with these unknowns, most employees are going to call the company help desk. They will probably get the answers they need, but it will cost them their time, and it will perpetuate the high costs to staff and maintain the company help desk.
 So, is it possible within an organization to have an assistant for every employee? With chatbots or virtual assistants, the answer is yes. Purpose-built chatbots can be created for human resources to answer employee FAQs (frequently asked questions), and in sales to help update CRM systems and get sales collateral and data quickly through a conversational user interface. Fishbowl Solutions is leveraging Oracle Mobile Cloud Service, Enterprise, and its intelligent chatbot feature, to create chatbots for these use cases and more. We will be discussing how these chatbots get created, and why chatbots need to be built to satisfy specific use cases at Collaborate 2018 during this session: Rise of the Bot Army with Oracle Mobile Cloud Enterprise, which takes place on Tuesday, April 24th from 1:15 to 2:15 PM. Come hear how chatbots can help sales, marketing, customer service, human resources, and other departments cut costs, automate routine or manual tasks, and provide 24 x 7 customer and/or employee engagement. And yes, if you get that promotion, a chatbot could help you get your new business cards: https://www.youtube.com/watch?v=rOkbMiV-j0s
You can also stop by Fishbowl’s booth #848 to see a demo of Fishbowl’s Atlas intelligent chatbot. For more information on Fishbowl’s activities at Collaborate 2018, please visit this page: https://www.fishbowlsolutions.com/about/news/collaborate/
The post Collaborate Preview #1: How a Chatbot Army Could Help Your Business appeared first on Fishbowl Solutions.
GSA Migration is Easier than Ever with the Mindbreeze Winter 2018 Release

Mindbreeze recently announced the Winter 2018 release of Mindbreeze InSpire which brings a number of new features and enhancements to Mindbreeze customers. One notable addition is the GSA Transformer Service which enables Mindbreeze to receive Google Search Appliance (GSA) queries and provide a GSA-formatted XML response. Add this to the list of GSA-friendly features already in place, and Mindbreeze continues to lead the way as an easy-to-implement GSA replacement. Read on to discover the top six ways Mindbreeze simplifies your GSA migration.
GSA Transformer ServiceThe newly released GSA Transformer Service enables a Mindbreeze client service (roughly comparable to a GSA front end) to accept GSA-formatted search requests. The GSA transformer service supports the following GSA search parameters:
- start
- num
- getfields
- requiredfields
- query operators
- filter
- paging
When calling the GSA Transfomer Service, Mindbreeze provides an XML response that is compatible with Google Search Appliance implementations. The Mindbreeze XML conforms to the GSA DTD and includes configured metadata, snippets, Dynamic Navigation (configured as Filters in Mindbreeze), and Spelling Suggestions (e.g. “Did you mean”). This new option means that GSA customers can migrate to Mindbreeze without having to re-implement their custom search pages, which reduces the implementation effort.
GSA Feed Adapter ServiceThe Mindbreeze GSA Feed Adapter service allows Mindbreeze to accept GSA-formatted XML feeds as a means of indexing content. Feeds can be sent in both metadata-and-URL and content feed formats. Feeds are submitted to the Mindbreeze appliance as a POST request to a specific port in much the same way as they were within the GSA. Feed content can also be mapped into collections as part of the GSA Feed Adapter configuration. Collections in Mindbreeze are simply additional metadata which can be added to content for the purposes of filtering or segmentation. The GSA Feed Adapter contains a built-in configuration option for copying collection definitions from the GSA and assigning fed content to these collections. The Mindbreeze GSA Feed Adapter service means that customers with feed-based GSA indexing customizations can keep using their existing integrations.
GSA Vocabulary Mode for SynonymsMindbreeze includes a number of query expansion features to support synonyms, replacements, and custom dictionaries. For customers already using GSA synonym files, Mindbreeze provides the option to use a GSA-formatted vocabulary definition. If you have a large number of such files, an entire directory can be configured with all the query expansion files downloaded from your GSA. Like the GSA, query expansion can be configured globally for the entire search appliance. This is the simplest option and a good choice if your query expansion rules are fairly universal. Mindbreeze customers also have the option to configure query expansion (e.g. synonyms) for specific data sources thereby opening the door to support more granular and use-case specific sets of terms.
Support for googleon/googleoff TagsFor many customers, there may be portions of web page content that you want to exclude from indexing. To address this, Google suggested the use of googleon/googleoff tags. By embedding googleon/googleoff tags in HTML documents, you can disable the indexing of a portion of a web page. As part of the Mindbreeze web crawler configuration, customers may opt to enforce the use of googleon/googleoff tags. This reduces rework necessary to restrict the scope of indexed web content during a GSA-to-Mindbreeze migration. Fishbowl leveraged this option when integrating this website with Mindbreeze.
GSA Configuration MigrationCustomers can expedite their implementation with the help of automated configuration mapping available from Mindbreeze. Their free service creates a Mindbreeze configuration file based on your existing GSA configuration. Typically between 60% and 80% of GSA settings can be migrated programmatically between the two search appliances and the rest can be addressed during implementation.
GSA-to-Mindbreeze Jumpstart for WebsitesFishbowl Solutions has been working with the Google Search Appliance since 2010 and has deep technical expertise around both the GSA and Mindbreeze. In order to simplify the transition, we’ve created the GSA-to-Mindbreeze Jumpstart for Websites. This three-day program is intended for customers migrating to Mindbreeze from the Google Search Appliance in order to provide website search capabilities. The Jumpstart is facilitated by one of Fishbowl’s Certified Implementation Experts and takes a collaborative approach to installing and configuring your appliance while training your team to manage it going forward. A training and scoping workbook is provided, and additional workshop days can be added to accommodate more complex implementations.
To learn more about how GSA features carry over to Mindbreeze, check out our previous post, How to Configure the Top 4 GSA Features in Mindbreeze – Plus 6 New Favorites. In the past eight years, we’ve helped numerous customers implement and maintain their GSAs. Despite the disruption caused by the GSA’s end of life, we’re excited about the many possibilities Mindbreeze has to offer. As a Mindbreeze partner, we provide resale, support, and implementation services. If you have questions or would like to know more, please contact us.
Our expert team knows both GSA and Mindbreeze. We’ll help you understand your options and design a migration plan to fit your needs.
The post GSA Migration is Easier than Ever with the Mindbreeze Winter 2018 Release appeared first on Fishbowl Solutions.
Fishbowl Solutions to Defend Trophy at Oracle Modern CX Hackathon: Hack a Smarter Customer Experience Event
Fishbowl Solutions’ Oracle Mobile and Intelligent Chatbots team will once again be participating in the Oracle Modern CX Hackathon: Hack a Smarter Customer Experience event, which takes place on Wednesday, March 28th and 29th. This is Oracle’s second biannual two-day “Hack a Smarter Customer Experience” event, and this year it takes place at the Oracle headquarters in Redwood Shores, California.
This event brings together Oracle partners from around the world to work on a technical challenge that showcases a unique business case utilizing an Oracle Customer Experience SaaS (Software as a Service) and Oracle PaaS (Platform as a Service) technology, or ISV (Independent Software Vendor) solutions. During the two day event, participants and teams have access to Oracle product management A-Team experts who can offer suggestions, provide access to necessary systems, and review code.
Fishbowl Solutions’ Oracle Mobile and Intelligent Chatbots team will once again be participating in the Oracle Modern CX Hackathon: Hack a Smarter Customer Experience event, which takes place on Wednesday, March 28th and 29th. This is Oracle’ second biannual two-day “Hack a Smarter Customer Experience” event, and this year it takes place at the Oracle headquarters in Redwood Shores, California.
This event brings together Oracle partners from around the world to work on a technical challenge that showcases a unique business case utilizing an Oracle Customer Experience SaaS (Software as a Service) and Oracle PaaS (Platform as a Service) technology, or ISV (Independent Software Vendor) solutions. During the two day event, participants and teams have access to Oracle product management A-Team experts who can offer suggestions, provide access to necessary systems, and review code.
Fishbowl won the inaugural Oracle hackathon event last year right before Oracle OpenWorld 2017. Last year’s team built SalesBot, which leverages the Oracle Intelligent Bot Cloud Service integrated with Oracle Engagement Cloud, Big Data Cloud Service, and Content and Experience Cloud. SalesBot is able to bring together customer data from multiple systems within a conversational user interface, including key contact details, opportunities, purchases, and forecast details. Using SalesBot saves valuable time as reps and managers don’t have to be at their computers and logged in to their CRM system, such as Salesforce, to manually enter, search, and retrieve customer data. More information on SalesBot can be found here.

Hackathon participants/teams are judged on the following criteria: Business Use Case – 40%; UX Factor – 40%, and Technology Implementation – 20%. This year’s winners will be announced in a LIVE Judging Session at Oracle Modern Customer Experience, which takes place from April 10 – 12 in Chicago.
Tim Gruidl, Fishbowl’s President and CEO, will be speaking at two sessions at Oracle Modern Customer Experience on Wednesday, April 11th and Thursday, April 12th. Both of his topics will be about how chatbots are streamlining business processes in the enterprises. For a preview of his sessions, please visit our Oracle Modern Customer Experience page.
The post Fishbowl Solutions to Defend Trophy at Oracle Modern CX Hackathon: Hack a Smarter Customer Experience Event appeared first on Fishbowl Solutions.