


Feed aggregator
Postgres recovery_prefetch Considered Harmful and Causing Outages
Another story of something I saw in the field which surprised me. Turns out recovery_prefetch can cause outages.
Something which has been happening quietly in the background all the time, but we didn’t notice until we looked close enough to see it.
After a lot of work I discovered this was partly a case where someone had dropped an email to the postgres hackers list years ago “hey what about this” and everyone thought “nah it can’t be that bad” … and now here we are seeing production outages!
Exhibit A: Feb 2021, while the feature was being developed, a year and a half before it shipped, Stephen Frost
- Issuing unnecessary prefetches for blocks we’ve already sent a prefetch for is arguably a concern even if FPWs are off but the benefit of doing the prefetching almost certainly will outweight that and mean that finding a way to address it is something we could certainly do later as a future improvement. I wouldn’t have any issue with that. Just doesn’t seem as clear-cut to me when thinking about the FPW-enabled case. Ultimately, if you, Andres and Munro are all not concerned about it and no one else speaks up then I’m not going to pitch a fuss over it being committed, but, as you said above, it seemed like a good point to raise for everyone to consider.
https://www.postgresql.org/message-id/20210214231815.GO27507@tamriel.snowman.net
Exhibit B: Mar 2025, clear report from the field, Michael Zhilin (Postgres Pro)
- One customer complained that physical standby has significant replay lag (few hours) on modern powerful bare metal servers. According to output of “top”, startup process and few kernel workers utilized CPU, mostly in kernel space. The incident has been resolved by disabling recovery_prefetch after quick analysis of perf and strace outputs. Actual XLog prefetching code doesn’t consider that shared buffer may be loaded from WAL FPI rather than from disk and makes fadvise calls in such cases.
https://www.postgresql.org/message-id/9bdb428a-fc8e-4801-8fff-1ad0bc6fa76b%40postgrespro.ru
Both of these emails were on the right track, but didn’t quite get the complete picture yet.
First: FPI/FPW is ubiquitous today. While it’s very expensive in terms of performance, it’s the only way Postgres has of protecting from torn writes on OS restarts. As a result, the majority of production Postgres installations today enable this.
Second: synchronous replication is becoming more common. There are really only two ways to completely protect community open source postgres against data loss on hardware failures: (1) storage layer replication with oss tech like DRBD or expensive proprietary storage & clustering technology or (2) database layer protection with postgres synchronous replication. The second option is the normal solution with kubernetes and commodity hardware.
Third: something that hasn’t previously been diagnosed/reported – the problem with recovery_prefetch isn’t just about FPIs, it’s also about the fact that when the primary instance does large sequential I/O, recovery_prefetch converts those operations into 8k random reads. For the same number of bytes read, this amplifies IOPS as much as 16x on replicas. This can easily exhaust available IOPS, causing replicas to significantly lag after write activity.
The read IOPS amplification combined with Postgres design for synchronous replication is what turns recovery_prefetch into an actual outage-inducing killer. And it turns out this is trivial to reproduce once you know the steps.
- Start up postgres with synchronous replication to a standby, on a small server with an inexpensive hard drive (for example: cloud disk with 500 IOPS, 2 CPUs, 8GB memory)
- Initialize pgbench scale 640 for about 10GB data
- Disable autovac on pgbench_accounts just so it doesn’t interfere with the experiment.
- Run pgbench at 5 TPS fixed in a terminal you can watch.
- Update 5% of the table. (Checkpoint and update pgbench_accounts where aid%20 = 0.) This generates a burst of write activity. Pgbench will slow down until it finishes. Wait for this to complete.
- Kill the walreceiver process to emulate what happens when there’s a hang or network instability that disrupts this connection.
- TPS drops to zero and all writes hang for over 30 minutes (can be hours with larger pgbench table).
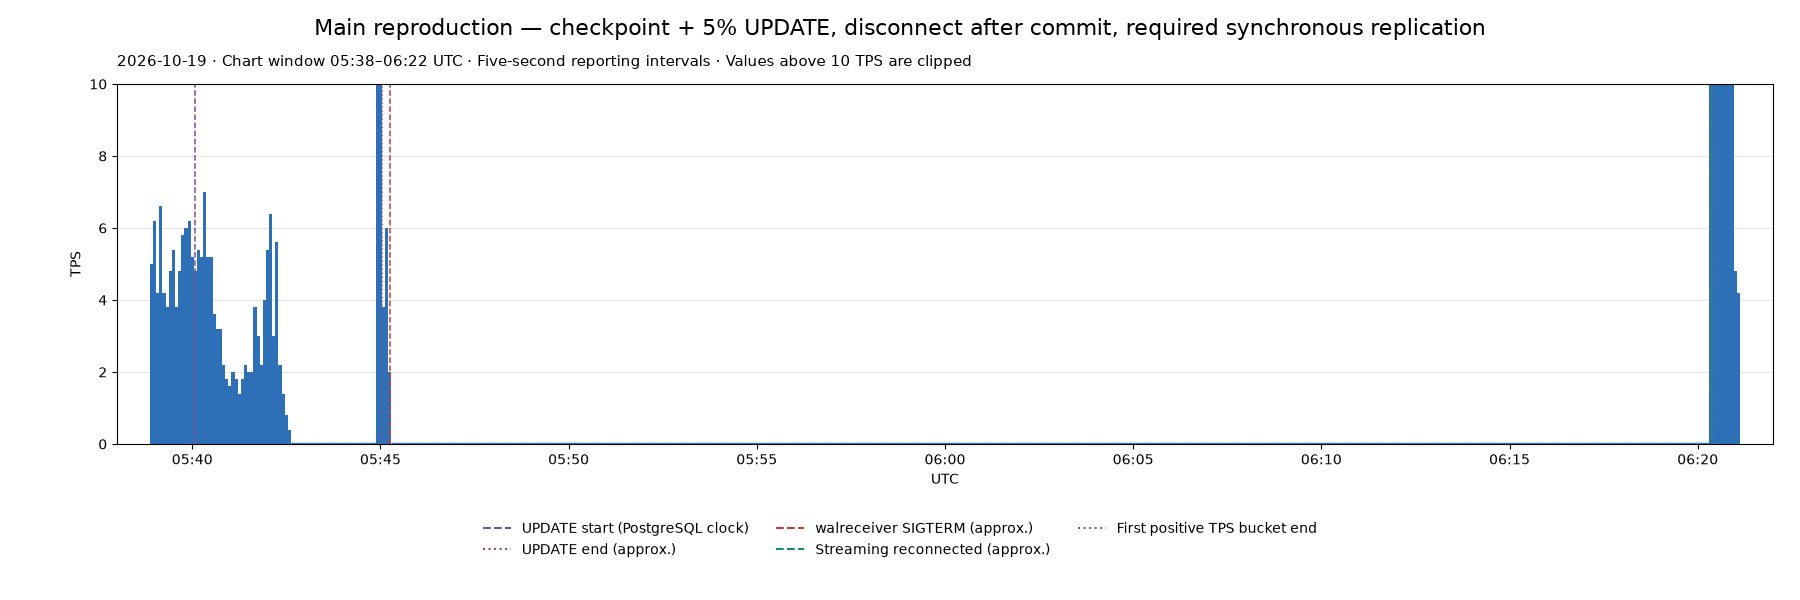
It really is this easy to consistently reproduce this outage. https://github.com/ardentperf-labs/walreceiver-outage-repro
And for what it’s worth, VACUUM itself is quite capable of producing write activity too. The recipe for an outage is simply “enough bad luck”: a network glitch that interrupts streaming replication at the same time as a burst of write activity.
To understand why the whole system hangs, it really comes down to two simple things: (1) synchronous replication and (2) the core “state machine” that defines a Postgres Standby Server.
Remember that with synchronous replication, we’re depending on at least one healthy standby server – otherwise we can’t take writes. (We want to guarantee durability to clients and ensure every transaction is on a remote machine before commit.)
The core standby server state machine is defined in src/backend/access/transam/xlogrecovery.c:
WaitForWALToBecomeAvailable(XLogRecPtr RecPtr, bool randAccess,
							bool fetching_ckpt, XLogRecPtr tliRecPtr,
							TimeLineID replayTLI, XLogRecPtr replayLSN,
							bool nonblocking)
{
	static TimestampTz last_fail_time = 0;
	TimestampTz now;
	bool		streaming_reply_sent = false;

	/*-------
	 * Standby mode is implemented by a state machine:
	 *
	 * 1. Read from either archive or pg_wal (XLOG_FROM_ARCHIVE), or just
	 *	  pg_wal (XLOG_FROM_PG_WAL)
	 * 2. Check for promotion trigger request
	 * 3. Read from primary server via walreceiver (XLOG_FROM_STREAM)
	 * 4. Rescan timelines
	 * 5. Sleep wal_retrieve_retry_interval milliseconds, and loop back to 1.
	 *
	 * Failure to read from the current source advances the state machine to
	 * the next state.
...
...
Fundamentally it looks like this:
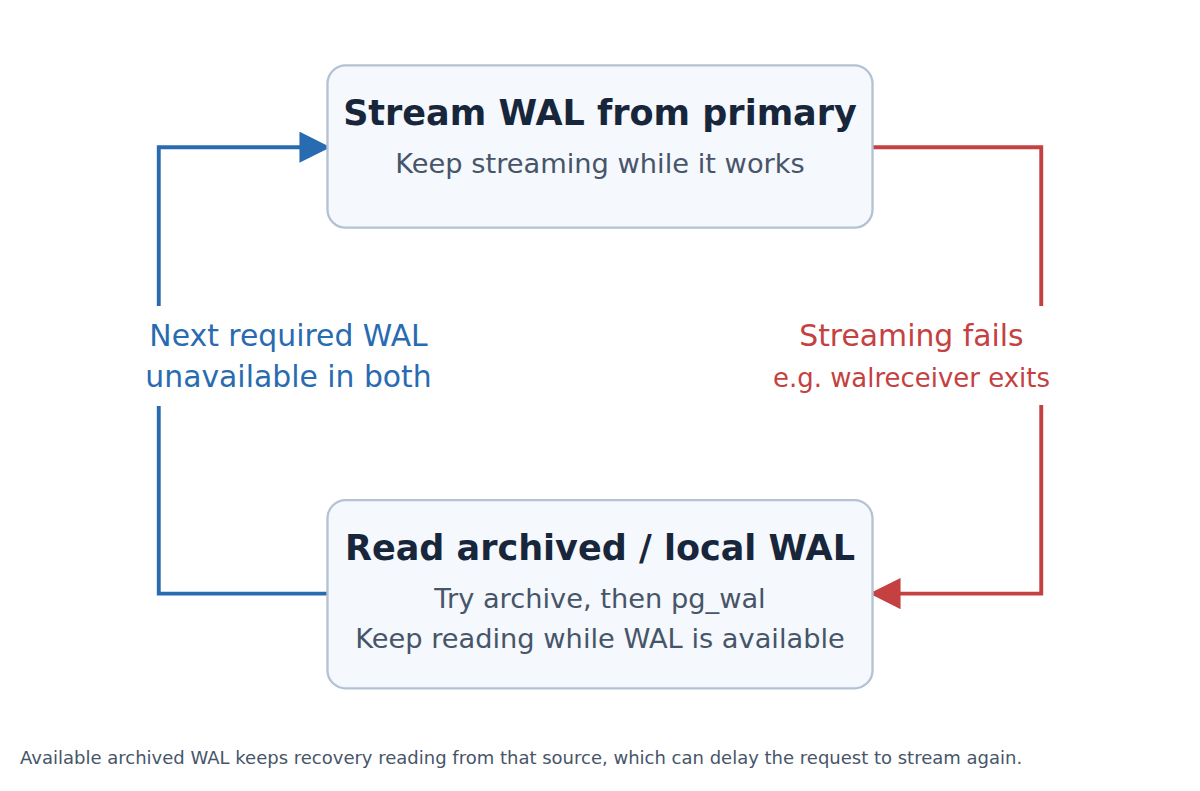
Basically, when a Postgres standby switches into WAL-restore mode, it will not go back to streaming until it’s caught up.
A burst of write activity combined with IOPS amplification on all the replicas that causes significant lag can easily mean the database won’t start streaming again for hours.
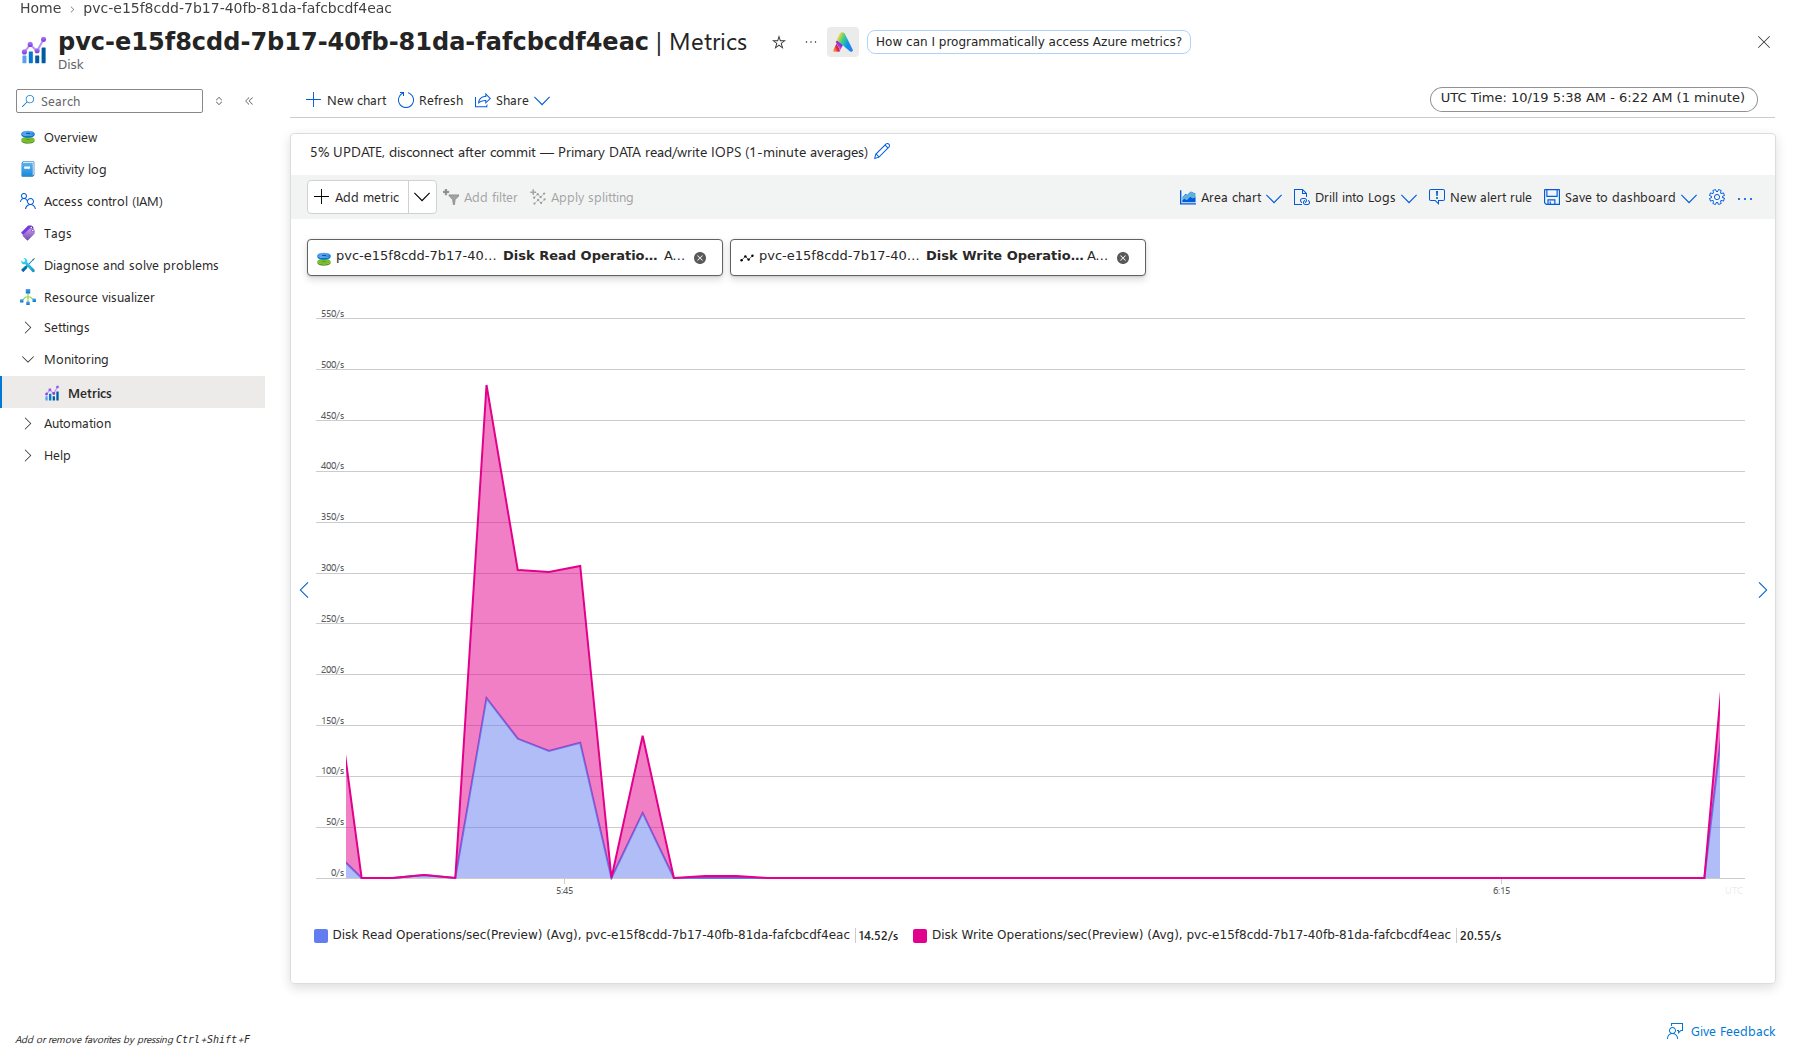
The IOPS amplification is very clear. Here are the disk stats for the primary (maybe 5 minutes around 300 IOPS):
Here are the disk status for the replica/standby during the same time period (40 minutes at the disk limit of 500 IOPS):
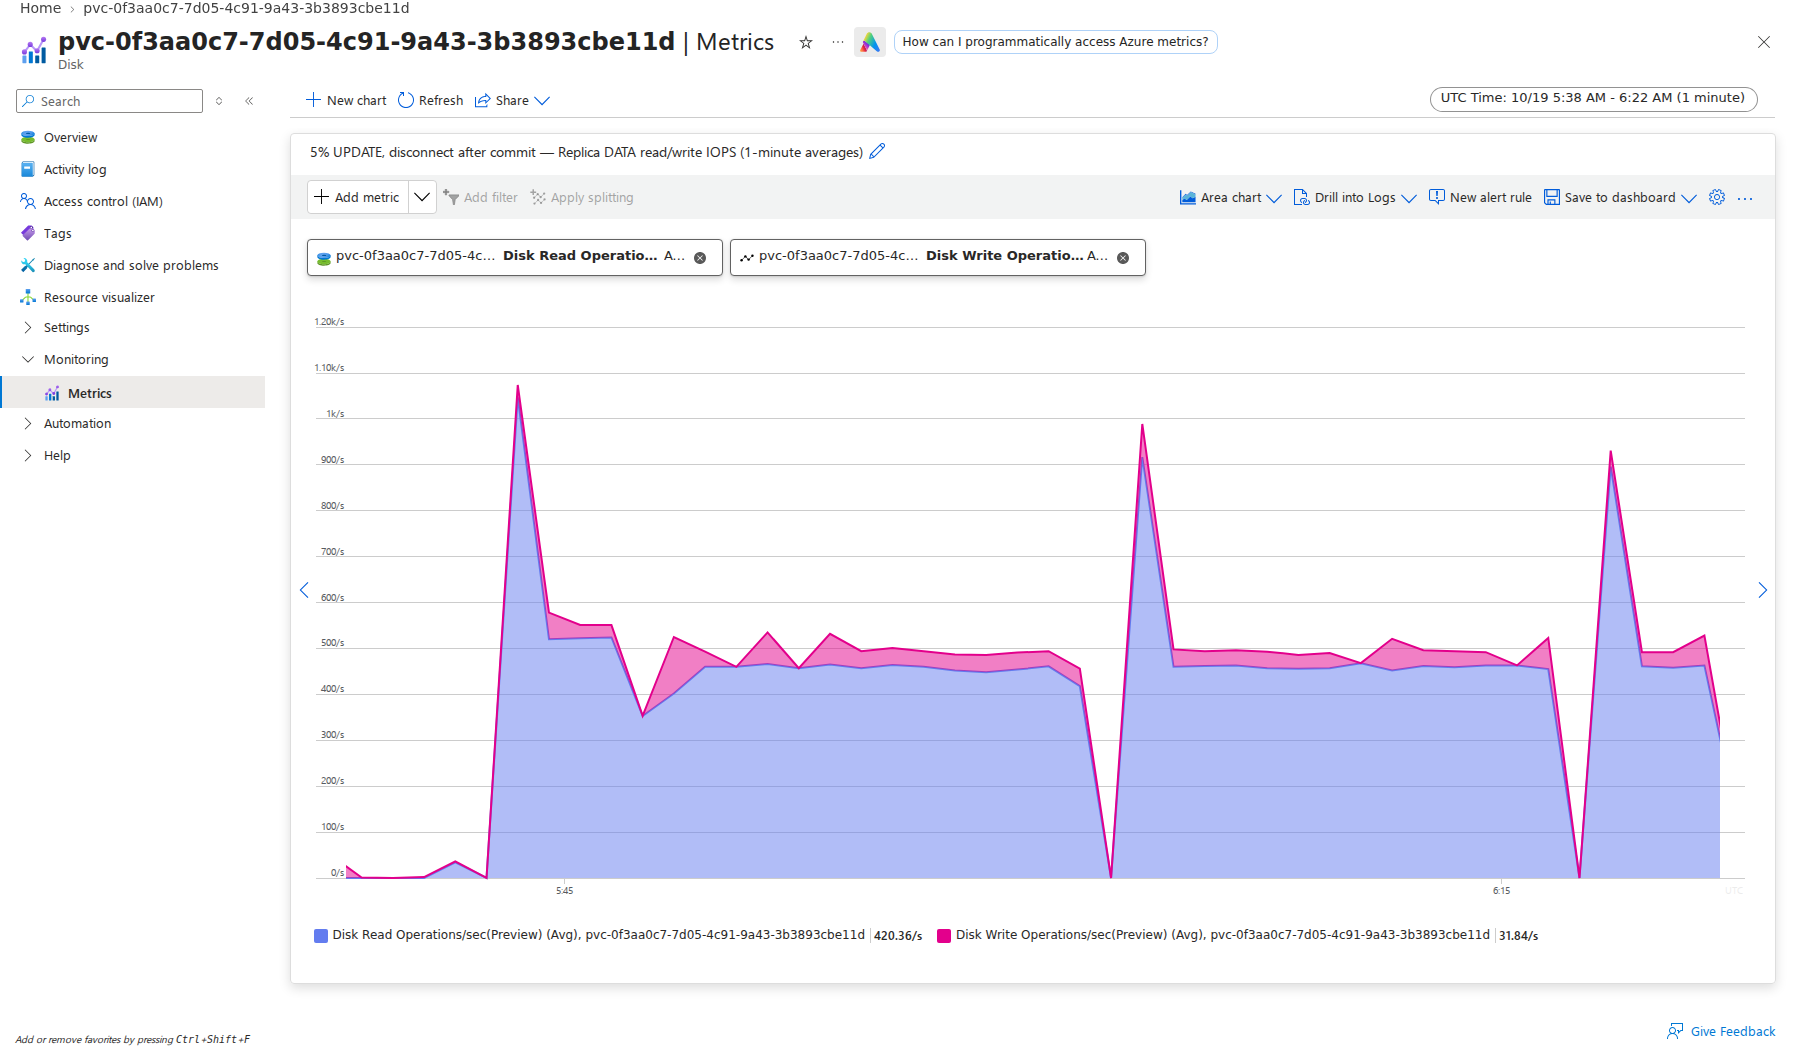
These charts don’t illustrate it, but the number of bytes read from disk is about the same.
What happens if we disable recovery_prefetch? (Note that FPWs remain enabled.)
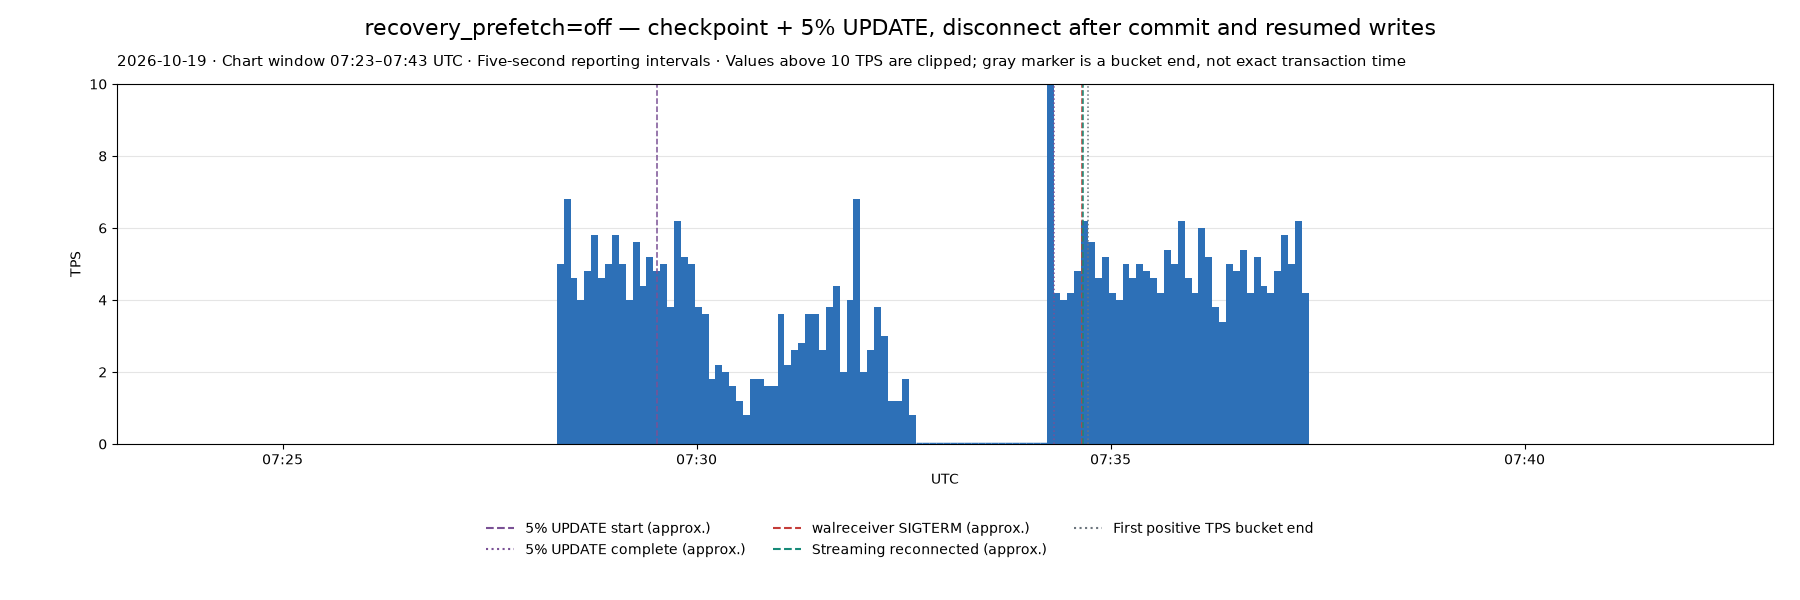
There’s still the pause during UPDATE but we didn’t see the long pause after UPDATE completes.
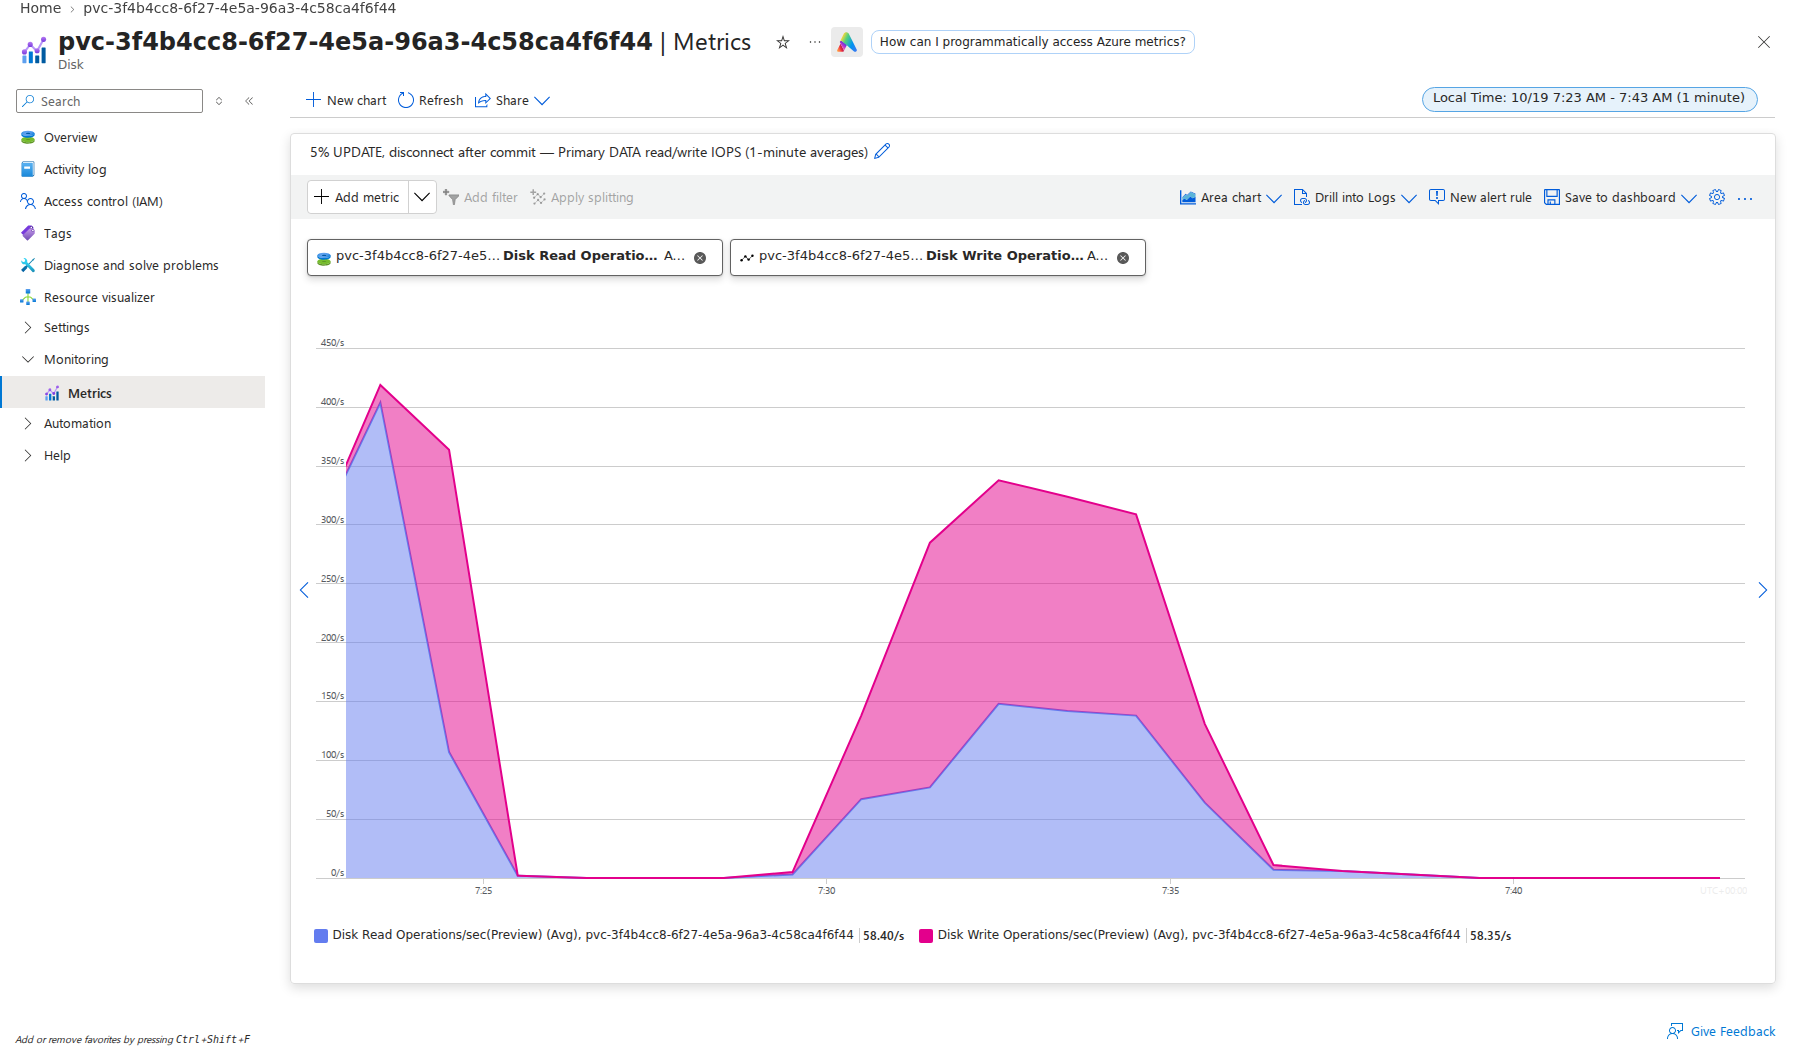
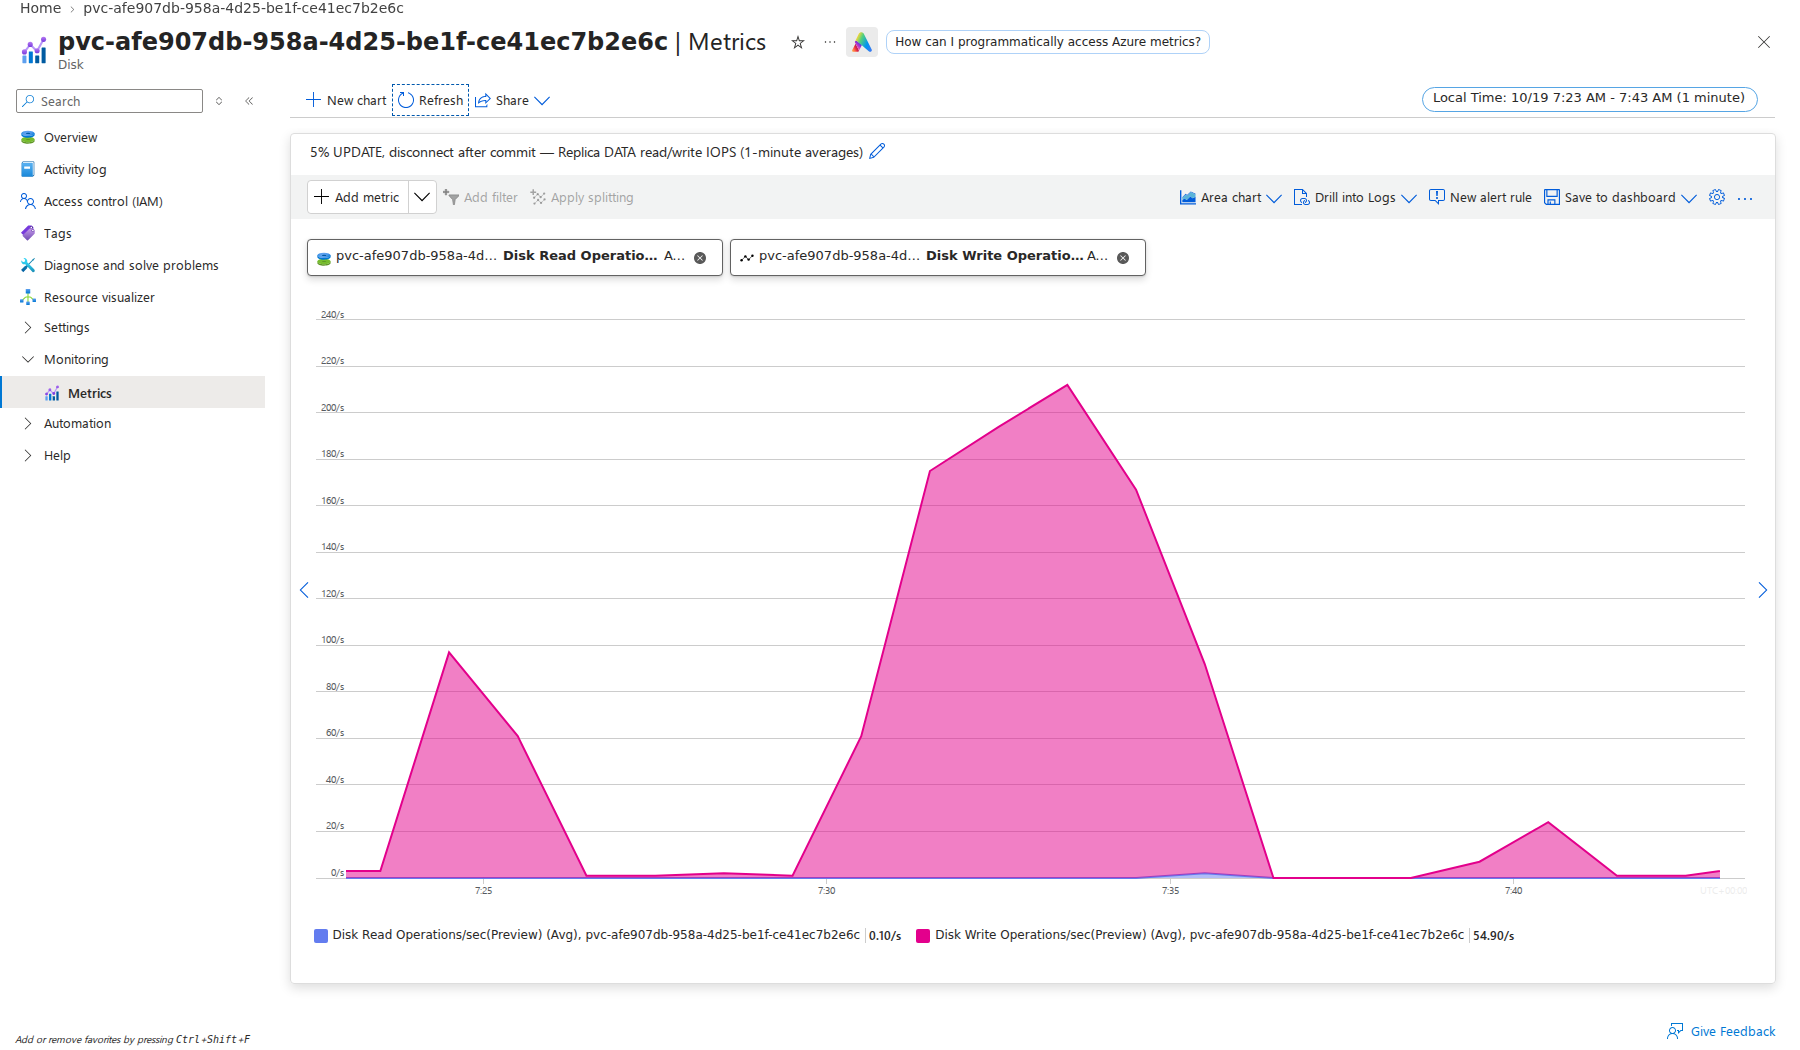
There is no burst of read IOPS, and the standby server basically stays caught up – applying the 5% update in less than 10 minutes.
Right now, I’m leaning toward disabling the recovery_prefetch setting across the board but I want to see where the discussions go.
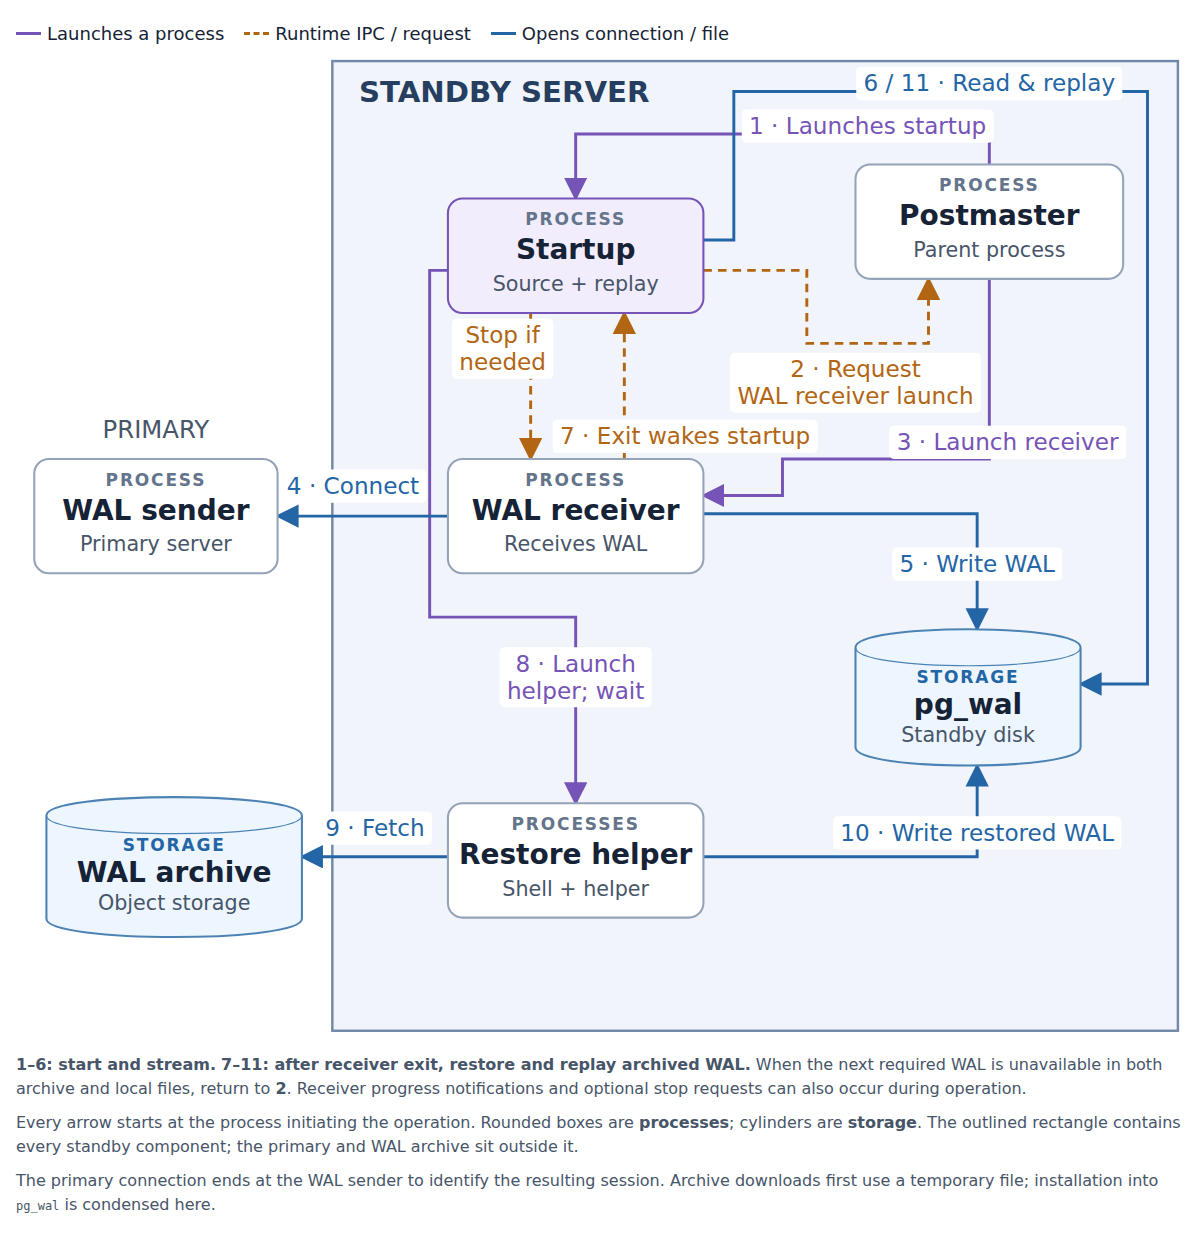
Here’s a more detailed refresher on the various processes involved in the core restore and replay logic of a postgres standby server.
Importantly, note the direction of the arrow between the WAL sender and WAL receiver. With synchronous replication in Postgres this connection is critical – the primary can’t accept writes without it. It’s also very fragile, because if the connection disappears the primary can only sit and wait, blocking all writes, hoping a standby will reconnect soon!
This is a reason to consider two standbys and quorum commit (ANY 1) with postgres. While it does increase cost to run with three total replicas instead of two, it significantly increases the robustness of the database.
Defending Your PL/SQL Code: Why Anchoring with %TYPE Saves the Day
You are loading an associative array and you are getting the following error:
ORA-06502: PL/SQL: value or conversion error:
associative array key violates its type constraints
 image created by Google Gemini
When I asked Gemini for this error message it said it had to do with a null value in the key but this is false, if the key value is null you'll get a different error message:
ORA-06502: PL/SQL: value or conversion error: NULL index table key value And there is also another interesting fact, if you explicitly assign an array element indexed by varchar2(n), in this fashion:
g_arr('') := 'something';
no error whatsoever, the whole array is wiped out, as if you executed g_arr.delete, and it's not clear to me if this is a bug or expected behavior.
So let's see the real reason for "associative array key violates its type constraints":
Create table config (config_key varchar2(50), config_value varchar2(500));

insert into config values('some_key', 'some value');
insert into config values('some_key_with_a_long_name', 'some other value');

declare
  type t_associative_array is table of varchar2(500) index by varchar2(10);
  g_arr      t_associative_array;
  k          varchar2(50);
begin
    FOR rec in (select config_key, config_value from config)
    LOOP
        g_arr(rec.config_key) := rec.config_value;
    END LOOP;

    k := g_arr.first;
    WHILE k IS NOT NULL LOOP
    DBMS_Output.PUT_LINE ('''' || k || ''':''' || g_arr(k)||'''');
    k := g_arr.NEXT(k);
  END LOOP;

end;
/
And bum!
ORA-06502: PL/SQL: value or conversion error:
associative array key violates its type constraints
The problem is that you declared the associative array key to be INDEX BY VARCHAR2(10), but the value coming from table is longer.
This type of problems can easily happen when you add new values over time whose length can be longer than original ones and you were a bit lazy when you wrote the code, declaring some variables with explicit data types to save some typing.
To avoid surprises you can rewrite the script as follows:
declare
  type t_associative_array is table of config.config_value%type
                                       index by config.config_key%type;
  g_arr      t_associative_array;
  k          config.config_key%type;
begin
    FOR rec in (select config_key, config_value from config)
    LOOP
        g_arr(rec.config_key) := rec.config_value;
    END LOOP;

    k := g_arr.first;
    WHILE k IS NOT NULL LOOP
    DBMS_Output.PUT_LINE ('''' || k || ''':''' || g_arr(k)||'''');
    k := g_arr.NEXT(k);
  END LOOP;

end;
/
This time it will output the values without errors.
'some_key':'some value'
'some_key_with_a_long_name':'some other value'

Statement processed.
Is this error specific for associative array key ?
Yes it is, if the problem is in the length of the value, you will get this error instead:
ORA-06502: PL/SQL: value or conversion error: character string buffer too smallThis distinction is good because it pinpoints the root cause of the problem.
Last but not least: watch out for the column and variable length semantics!
If you store the keys containing some variable length characters and you defined the associative array using byte semantics using explicit data types, you could incur in the same errors and be confused as the length of the key or the value seem to be within the valid range.
The best solution, and best practice by the way, is to define the array and the variables as shown above, referring to the table columns definition.
Striim MDR on PostgreSQL: Fixing striimsecuritytable does not exist
Striim won’t start on a new PostgreSQL MDR? If postgres owns the striim schema, here’s how to find it and fix the issue.
The post Striim MDR on PostgreSQL: Fixing striimsecuritytable does not exist appeared first on DBASolved.
Joel Kallman Day 2026 : It’s a Wrap! (#JoelKallmanDay)
Yesterday was an Oracle community day called the Joel Kallman Day (#JoelKallmanDay) 2026. I would like to say a big thank you to everyone who took the time to join in. Here is the list of posts I saw. If I missed you out, give me a shout and I’ll add you. Thanks to everyone who … Continue reading "Joel Kallman Day 2026 : It’s a Wrap! (#JoelKallmanDay)"
The post Joel Kallman Day 2026 : It’s a Wrap! (#JoelKallmanDay) first appeared on The ORACLE-BASE Blog.Joel Kallman Day 2026 : It’s a Wrap! (#JoelKallmanDay) was first posted on October 15, 2026 at 8:05 am.©2024 "The ORACLE-BASE Blog". Use of this feed is for personal non-commercial use only. If you are not reading this article in your feed reader, then the site is guilty of copyright infringement. Please contact me at timseanhall@gmail.com
A Practical Guide to Oracle Regex
If you've ever pulled thousands of rows into an application just to check whether a product code looks right, this post is for you. Oracle's built-in regular expression functions let you validate, search and tidy text right where the data lives, so you don't need extra string-handling code in every app that touches the table.
Oracle gives you one condition and four functions:
REGEXP_LIKEA true/false test, used in WHERE clauses and constraints
REGEXP_COUNTHow many times a pattern shows up
REGEXP_INSTRThe position where a match starts (or ends)
REGEXP_SUBSTRThe matching text itself
REGEXP_REPLACEThe string with matches swapped for something else
Each accepts an optional match-parameter string. The useful flags are i (ignore case), c (respect case), n (let the dot match a newline), m (treat each line as its own line for anchors) and x (ignore spaces in the pattern).
CREATE TABLE stock_items (
  sku            VARCHAR2(20),
  item_desc      VARCHAR2(100),
  supplier_email VARCHAR2(80),
  delivery_date  VARCHAR2(10),
  handling_note  VARCHAR2(200)
);

INSERT INTO stock_items VALUES
 ('BRK-0215',  '  Heavy duty   brake rotor 330mm ', 'accounts@brakeworks.example.com.au', '07/03/2026',
  '<note>fragile</note><note>keep dry</note>');
INSERT INTO stock_items VALUES
 ('ROT-1180B', 'Rotor rotor bolt kit',  'sales@boltbarn.example.com.au', '19/11/2026',
  '<note>pallet only</note>');
COMMIT;
1. Guarding the door with a CHECK constraint
Say every SKU must be three capital letters, a hyphen, four digits, and optionally one trailing capital letter. One constraint handles it for every application:
ALTER TABLE stock_items ADD CONSTRAINT ck_sku_shape
  CHECK (REGEXP_LIKE(sku, '^[A-Z]{3}-[0-9]{4}[A-Z]?$', 'c'));
The anchors ^ and $ force the whole value to fit the pattern, and the c flag keeps lowercase letters out. Results:
BRK-0215    accepted
ROT-1180B   accepted
brk-0215    rejected (lowercase)
BRK0215     rejected (no hyphen)
BRK-215     rejected (only three digits)
BRK-0215BB  rejected (two trailing letters)
2. Counting words
SELECT item_desc,
       REGEXP_COUNT(item_desc, '\w+') AS word_count
FROM   stock_items;
For 'Rotor rotor bolt kit' this returns 4. It's a quick way to flag descriptions that are too short to be useful.
To get each supplier's domain, capture it in a group and ask for that group with the sixth argument:
SELECT REGEXP_SUBSTR(supplier_email, '@(\S+)$', 1, 1, NULL, 1) AS supplier_domain
FROM   stock_items;
brakeworks.example.com.au
boltbarn.example.com.au
The @ is matched but left out of the result, because only the bracketed group is returned.
SELECT REGEXP_INSTR('Rotor kit 330mm', '\d')           AS first_digit,
       REGEXP_INSTR('Rotor kit 330mm', '\d+', 1, 1, 1) AS just_after_number
FROM   dual;
FIRST_DIGIT  JUST_AFTER_NUMBER
-----------  -----------------
         11                 14
The fifth argument, 1, asks for the position immediately after the match instead of its start.
Our first row has leading, trailing and doubled spaces:
SELECT REGEXP_REPLACE(TRIM(item_desc), '\s{2,}', ' ') AS tidy_desc
FROM   stock_items;
' Heavy duty brake rotor 330mm ' becomes 'Heavy duty brake rotor 330mm'. Any run of two or more whitespace characters collapses into one space.
A back reference lets you reuse what a group captured. Here we convert Australian-style dates (DD/MM/YYYY) to ISO format:
SELECT delivery_date,
       REGEXP_REPLACE(delivery_date,
                      '^(\d{2})/(\d{2})/(\d{4})$',
                      '\3-\2-\1') AS iso_date
FROM   stock_items;
07/03/2026   2026-03-07
19/11/2026   2026-11-19
Rows that don't fit the pattern pass through unchanged, so test for that before trusting the output.
Back references also catch accidental repeats, such as "Rotor rotor":
SELECT sku
FROM   stock_items
WHERE  REGEXP_LIKE(item_desc, '(^| )(\w+) \2( |$)', 'i');
Group 2 captures a word, and \2 demands the same word straight after it. This flags ROT-1180B.
By default, quantifiers grab as much as they can. Adding ? makes them take as little as possible:
SELECT REGEXP_SUBSTR(handling_note, '<note>.*</note>')  AS greedy,
       REGEXP_SUBSTR(handling_note, '<note>.*?</note>') AS lazy
FROM   stock_items
WHERE  sku = 'BRK-0215';
GREEDY                                          LAZY
----------------------------------------------  ---------------------
<note>fragile</note><note>keep dry</note>      <note>fragile</note>
Greedy runs to the last closing tag, while lazy stops at the first.
Gotchas worth remembering- Character classes need two sets of brackets. Write
[[:upper:]]+, not[:upper:]+. The inner pair names the class and the outer pair makes it a list. - Don't assume Perl, Python or JavaScript syntax carries over. Oracle supports shortcuts like
\d,\wand\s, but not word-boundary markers (\b) or lookaheads. - Escape literal metacharacters. To match a real dot or bracket, use
\.or\(. - Mind performance. A regex condition on a large column usually can't use an ordinary index. If a pattern query is hot, consider a function-based index or a cheaper pre-filter such as
LIKE. - Multibyte text works, but write characters directly. Oracle matches on encoded bytes rather than
\uXXXXescapes.
Start with a constraint on your messiest column, since that's where the payoff is quickest. Then add REGEXP_SUBSTR and REGEXP_REPLACE to your reporting queries. Once you've written a few patterns, you'll find a lot of application-side string handling can simply be deleted.
Who owns the information? Data ownership and stewardship in an ECM
I often see this pattern in organizations. The ECM project was an overall success: the migration is complete, and users are happy with the new solution. But after a year or two, the magic faded. Search results are cluttered with duplicates, metadata is inconsistent, permissions have drifted, and nobody dares to delete anything. Some users have gone back to using shared drives.
The platform itself is not the cause; it simply does what it was configured to do. The real problem is that nobody was ever clearly responsible for the information. The project had a sponsor, a manager and a budget. The information had none of these.

I touched on this topic briefly in previous posts (Why ECM Projects fail or Information debt), but let’s take a closer look.
The question remains unansweredBecause it is organizational and political rather than technical, it feels more challenging than a workshop on vault structure. It also seems to be something for ‘phase two’, which rarely receives the same level of attention. Business users assume IT handles it, and IT assumes the business does. Furthermore, ‘ownership’ can mean different things to different people, such as who created the document, who is accountable for it, who can edit it and who decides when it should be deleted.
Four different rolesI think we should start by defining the four crucial roles.
- Data owner is a business role that is accountable for a category of information. For example, the HR director is responsible for personnel files. The owner decides on the rules for classification, retention and access.
- Data steward ensures that these rules are followed on a daily basis. They monitor metadata quality, handle exceptions and propose improvements. This is the role that is most often missing.
- Custodian is usually IT. They keep the platform secure, backed up and running, but they should not decide what the information means or how long it is kept.
- Contributors are users who create and edit content. Being the author of a document does not make you the owner of its information.
In short: owners decide, stewards organize, custodians protect, users contribute.
When one of these is missing, the others compensate badly. IT ends up making business decisions, or users end up inventing their own conventions.
Why it matters even more in M-FilesM-Files organizes information based on its metadata, not its storage location. The metadata model is a shared contract, and every contract needs someone to take responsibility for it.
- Who approves new classes or values in a value list? Without a clear answer, terms such as ‘Contract’, ‘Contracts’ and ‘Agreement’ end up coexisting.
- Who decides which properties are mandatory?
- Who in the business owns each workflow, since only they know when the process changes?
- Who reviews permissions as people and organizations change?
- Who validates retention and destruction rules?
AI adds urgency. Whether you use M-Files Aino or another AI capability, the quality of the answers depends on the content: accurate metadata, no duplicates and no obsolete documents being passed off as current. AI does not fix a governance gap, it exposes it.
Making ownership explicitI recommend the following six best practices. You should use them in any ECM solution.
- Ask early and write it down. For each information domain, name the owner, the steward(s), the custodian and the applicable rules. A simple table validated by management is enough.
- Name roles, not just people, with a deputy, so the organization survives a departure or reorganization.
- Give stewards time and tools. Use M-Files views that surface missing metadata, notifications and dashboards to make the work lighter.
- Define a light change process for the metadata model, such as a monthly review between steward and administrator.
- Schedule reviews: quarterly on data quality, twice a year on permissions, yearly on retention and the model itself.
- Hand over governance at go-live, not just a configured vault: the roles, the decisions and the reasons behind them.
If you want to evaluate where you are with your solution, try to answer the following questions:
- Can you name the person accountable for each type of document?
- Who can approve a new document class?
- Who decides when a document can be deleted?
- When did the business last review access to sensitive information?
- If your ECM administrator left tomorrow, would the rules still be understood?
Expert level: Who are the deputies?
If you answered ‘I don’t know’ or ‘I’m uncertain’ to at least one question, then you have identified a risk before it becomes a failed project.
Information needs an ownerSuccessful ECM projects are rarely lost on technology. They are lost slowly, in the months after go-live, through a lack of clear responsibility. The platform keeps working while the information quietly loses its value.
The fix is not complicated, but it does require a decision: information needs owners, just like budgets and projects do. Asking ‘Who owns the information?’ early, and writing down the answer, is one of the cheapest and most effective investments you can make in an ECM.
If you are planning a project, or wondering why a past one is not delivering what it promised, this is a good question to start with. And if you would like to discuss how to set up ownership and stewardship in your own M-Files environment, feel free to reach out.
L’article Who owns the information? Data ownership and stewardship in an ECM est apparu en premier sur dbi Blog.
RAG Time with APEX for #JoelKallmanDay
What is the best approach when it comes to execute a semantic search for RAG (Retrieval Augmented Generation) in OllAPEX ?
OllAPEX is an Oracle APEX workbench designed for local LLM integration via Ollama, with semantic search over documents (such as Oracle skills repositories or excerpts from Oracle documentation) amongst other functions.
The main purpose of semantic search report applied to the Oracle Skills or other Oracle documents is to test a search before implementing a RAG mechanism inside OllAPEX itself.
The Real-World Context: Semantic Search in OllAPEXIn OllAPEX, semantic search allows users to query vector-embedded markdown files directly from an APEX interface.
               [ User Input Topic / Query ]
                           │
                           ▼
          ollapex.semantic_search(:TOPIC, ...)
                           │
                           ▼
          JSON_TABLE (Extract Top N Chunks)
                           │
                           ▼
    Join with OLLAPI_DOCUMENT_CHUNKS & UPLOADS
                           │
                           ▼
           [ Render Results in a report  ]
The underlying SQL query calls a PL/SQL vector search function ollapex.semantic_search(), parses the returning JSON payload via JSON_TABLE, and joins the parsed rows with document chunk metadata tables (ollapi_document_chunks and ollapi_uploads_for_embedding). Here is the user-facing application displaying semantic search results for queries over chunks of Oracle skills in markdown format:
 picture #1, semantic search report
The initial version of the query behind the report looked like this:
 picture 2, semantic search query
And its execution plan:
 picture 3, execution plan for the initial semantic search query
Then I thought: how can I ensure that the CTE is executed only once as I don't want that the prompt embedding function is called more times than necessary ?
To ensure the vector search function in the CTE executes only once, I added a /*+ MATERIALIZE */ hint:
 picture 4, query with MATERIALIZE hint added
And this is the execution plan that I got:
 picture 5, execution plan for the semantic search query with MATERIALIZE
As you see the cost is slightly increased and now there is a FULL scan on the temporary table created by the MATERIALIZE hint. No big deal but it doesn't look like an improvement to me.
But wait, is this the best way to tackle this problem?
In the end if I want to be sure that the embedding function is executed only once and there are no dependencies from what follows, then I am better off separating the embedding phase from the search phase:
 dynamic action doing the embedding before running the report
So when the user clicks on the search button, a dynamic action performs the embedding on user's prompt and returns the results as a JSON array (CLOB).
The final query eventually uses the vector to perform the semantic search:
 final semantic search query
Since there are no vector indexes defined (yet), the execution plan remains identical to that of picture 3, thus performing a so-called "exact" similarity search but now I am 100% sure that the embedding request will be performed just once.
Have a nice #JoelKallmanDay, remembering Joel, Scott and Carl.
Continuous Delivery of Oracle Database Features #JoelKallmanDay
As my entry for #JoelKallmanDay 2026, I thought I would write about the continuous delivery of Oracle database features. Quick history lesson In the past there used to be quite a slow release cycle for the database. It varied a lot over the years, but it moved towards a first and second release of each … Continue reading "Continuous Delivery of Oracle Database Features #JoelKallmanDay"
The post Continuous Delivery of Oracle Database Features #JoelKallmanDay first appeared on The ORACLE-BASE Blog.Continuous Delivery of Oracle Database Features #JoelKallmanDay was first posted on October 14, 2026 at 7:38 am.©2024 "The ORACLE-BASE Blog". Use of this feed is for personal non-commercial use only. If you are not reading this article in your feed reader, then the site is guilty of copyright infringement. Please contact me at timseanhall@gmail.com
Sawn-off by SQL*Plus – how to prevent it rounding long numeric values #JoelKallmanDay
Whenever I need to generate a CSV in a batch routine, I turn to good old SQL*Plus. However, when testing such a routine recently, I came across a behavioural quirk which left me a bit stumped. Hopefully, what follows will help others avoid falling down the rabbit hole I found myself in when trying to figure out just what was happening…
TL;DRIf you’ve hit this bug and landed here desparately seeking a solution then you’re probably not in the mood for the ramble that follows, so *spoiler alert* – the cluprit is the numwidth SQL*Plus environment variable, which is set to 10 by default. Any number that is longer than 10 characters (including any decimal point) will get rounded.
The solution is to set this variable to a higher value ( it goes up to 128).
If you’ve a bit more time on your hands and would like to know the gory details, read on…
Read more: Sawn-off by SQL*Plus – how to prevent it rounding long numeric values #JoelKallmanDay EnviornmentThe following examples have been run on Oracle 19c Enterprise Edition running on Oracle Linux. The SQL*Plus version is 19.3.
Fun with NumbersLet’s look at a very simple query which just returns some numeric values
with cash as( select 1 as id, 1 as amount from dual union all select 2 as id, 12 as amount from dual union all select 3 as id, 123 as amount from dual union all select 4 as id, 1234 as amount from dual union all select 5 as id, 12345 as amount from dual union all select 6 as id, 123456 as amount from dual union all select 7 as id, 1234567 as amount from dual union all select 8 as id, 12345678 as amount from dual union all select 9 as id, 123456789 as amount from dual union all select 10 as id, 1234567890 as amount from dual union all select 11 as id, 1234567.24 as amount from dual)select id, amount from cashorder by id/
Yes, I know I don’t need to repeat the column aliases on every line of the with query but it does help to line up the values nicely (more-or-less).
Anyhow, run this and we get :

So far, so normal. But notice what happens if we use longer values…
with cash as( select 1 as id, 12345678.41 as amount from dual union all select 2 as id, 123456789.15 as amount from dual union all select 3 as id, 1234567890.87 as amount from dual)select id, amount, to_char(amount) as actual_value_stringfrom cash order by id/
	ID     AMOUNT ACTUAL_VALUE_STRING
---------- ---------- ----------------------------------
	 1 12345678.4 12345678.41
	 2  123456789 123456789.15
	 3 1234567891 1234567890.87
So the amount values are now rounded (aka WRONG !).
To understand why this might be happening, let’s combine our queries and show the lengths of each value :
with cash as( select 1 as id, 1 as amount from dual union all select 2 as id, 12 as amount from dual union all select 3 as id, 123 as amount from dual union all select 4 as id, 1234 as amount from dual union all select 5 as id, 12345 as amount from dual union all select 6 as id, 123456 as amount from dual union all select 7 as id, 1234567 as amount from dual union all select 8 as id, 12345678 as amount from dual union all select 9 as id, 123456789 as amount from dual union all select 10 as id, 1234567890 as amount from dual union all select 11 as id, 1234567.24 as amount from dual union all select 12 as id, 12345678.41 as amount from dual union all select 13 as id, 123456789.15 as amount from dual union all select 14 as id, 1234567890.87 as amount from dual)select id, amount, length(amount) as amount_length from cashorder by id/
	ID     AMOUNT AMOUNT_LENGTH
---------- ---------- -------------
	 1	    1		  1
	 2	   12		  2
	 3	  123		  3
	 4	 1234		  4
	 5	12345	          5
	 6     123456    	  6
	 7    1234567             7
	 8    2345678	          8
	 9  123456789   	  9
	10 1234567890	         10
	11 1234567.24	         10
	12 12345678.4	         11
	13  123456789	         12
	14 1234567891	         13
It looks like anything longer than 10 characters (including the decimal point) is getting rounded.
It turns out, the culprit is this innocent-looking SQL*Plus environment setting :
show numwidthnumwidth 10
The 19c Documentation says that numwidth defines “the default width for displaying numbers.”
It goes on to say that
“COLUMN FORMAT settings take precedence over SET NUMFORMAT settings, which take precedence over SET NUMWIDTH settings.”
What is doesn’t say is what the value range is, so let’s experiment.
First of all, let’s see if you can turn it off, as you can with some other SQL*Plus environment settings, by setting it to 0 :
set numwidth 0SQL> set numwidth 0SP2-0267: numwidth option 0 out of range (2 through 128)
OK, let’s set it to it’s maximum value then :
set numwidth 128
Initially, this seems to work fine, but if you then try to run a query returning any numeric value you run into problems :
SQL> select 1 from dual;SP2-0253: data item 1 ("1") will not fit on lineSQL>
This is because we still have the linesize variable set to it’s default value :
SQL> show lineslinesize 80
Setting it to something larger than 128 solves the problem :
set lines 130select 1 from dual;
Fortunately for me, this does not mean that there is suddenly lots of leading spaces for numeric values if I’m generating csv output :
set markup csv on delimiter , quote onwith cash as( select 1 as id, 1 as amount from dual union all select 2 as id, 12 as amount from dual union all select 3 as id, 123 as amount from dual union all select 4 as id, 1234 as amount from dual union all select 5 as id, 12345 as amount from dual union all select 6 as id, 123456 as amount from dual union all select 7 as id, 1234567 as amount from dual union all select 8 as id, 12345678 as amount from dual union all select 9 as id, 123456789 as amount from dual union all select 10 as id, 1234567890 as amount from dual union all select 11 as id, 1234567.24 as amount from dual union all select 12 as id, 12345678.41 as amount from dual union all select 13 as id, 123456789.15 as amount from dual union all select 14 as id, 1234567890.87 as amount from dual)select id, amount, length(amount) as amount_length from cashorder by id/

Another point to note is that the linesize error only appears to be triggered when you’re outputting to the screen. Obviously, this is not the case in a batch job generating a CSV file.
Using a settings script for CSVsRather than having to remember to set numwidth to an appropriate value for all of my CSV generating scripts, I think I’ll just use a settings script ( csv_settings.sql ):
set feedback offset echo offset termout offset markup csv on delimiter , quote onset numwidth 128
Then I can just call it as part of my csv scripts :
@csv_settings.sqlspool cash.csvwith cash as( select 1 as id, 1 as amount from dual union all select 2 as id, 12 as amount from dual union all select 3 as id, 123 as amount from dual union all select 4 as id, 1234 as amount from dual union all select 5 as id, 12345 as amount from dual union all select 6 as id, 123456 as amount from dual union all select 7 as id, 1234567 as amount from dual union all select 8 as id, 12345678 as amount from dual union all select 9 as id, 123456789 as amount from dual union all select 10 as id, 1234567890 as amount from dual union all select 11 as id, 1234567.24 as amount from dual union all select 12 as id, 12345678.41 as amount from dual union all select 13 as id, 123456789.15 as amount from dual union all select 14 as id, 1234567890.87 as amount from dual)select id, amount, length(amount) as amount_length from cashorder by id/spool off
If you want to know more about Joel Kallman Day then – as with so much else in the Oracle world – Oracle Base is probably a good place to start.
Pages
