Re: High Buffer busy waits
Date: Thu, 10 Aug 2023 10:21:50 +0530
Message-ID: <CAEzWdqcPg2cG1R9DY2nSHTLhztO37gB+5wKz_pzxvyLc2-_xzg_at_mail.gmail.com>
Thank you so much for all the details so far.
We are finally planning to move to 19.19. We will monitor the wait chain's behaviour post upgrade.
One thing , Not sure if others have encountered it, but many times while running Tanel's dash_wait_chains/ash_wai_chain scripts for monitoring the wait chain for a certain sample time interval, it fails with error "*ORA-01489: result of string concatenation is too long*". Anybody encountered that?
Regards
On Thu, Aug 3, 2023 at 1:49 AM Ilmar Kerm <ilmar.kerm_at_gmail.com> wrote:
> We have similar issue on an large analytic RAC with very busy write load.
> I'm quite sure it is a bug, since 19.17+patch for 33973908 the problems
> just stopped, but now with 19.18+33973908 the problems have resurfaced a
> little again.
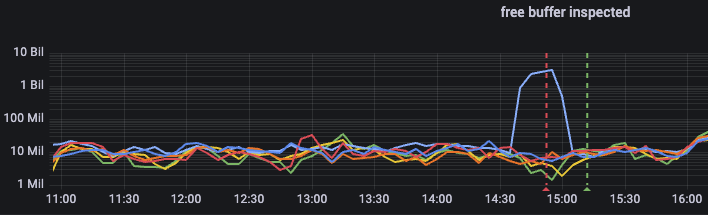
> But how do we work around that is we have an alert on metric "free buffer
> inspected" and when the problem is about to happen/happening, this metric
> will have a dramatic increase (from millions to billions) on one instance -
> and when this alert goes off, 2nd line DBA is instructed to log in to the
> problematic instance and flush the buffer cache. This resolves the issue -
> and since it only happens on an analytics database, it has been good
> enough. I'm attaching an image from Grafana to show the dramatic jump on
> log 10 scale.
> Since we also have DB flash cache configured - the same dramatic jump also
> happens for metric "flash cache insert skip: DBWR overloaded".
> [image: Screenshot 2023-08-02 at 22.11.55.png]
>
> On Wed, 2 Aug 2023 at 21:44, yudhi s <learnerdatabase99_at_gmail.com> wrote:
>
>> Thank you Tanel.
>>
>> I tried to run the dash_wait_chains2.sql and the output is similar as
>> below, i.e the ultimate blocker appears to be the DB writer only. Posting
>> the output as below.
>>
>> As you mentioned, to see how busy the lgwr,dbwr,ckpt processes are , so i
>> was trying to see to run the snapper script(in location in github
>> https://github.com/tanelpoder/tpt-oracle/blob/master/snapper.sql), but
>> it seems to be only fetching real time performance information from v$
>> views but not the historical views(like dba_hist**). We have had this issue
>> occur in the past for a few times and lasted for 2-3minutes. It's not
>> currently occurring as we are on the secondary database, but will mostly
>> occur when we will move back to the primary side. So , is there any way to
>> run snapper for the historical performance data(from dba_hist* views) to
>> see how busy the lgwr,dbwr,ckpt processes were during those historic snap
>> times?
>>
>> _at_Stefan, as the doc is stating to change those underscore
>> parameters(_db_writer_coalesce*) so i believe we have to seek oracle
>> blessing before changing any of those just to avoid any downside of those.
>> And we have never done the profile of the C-stack of any process before, so
>> we need to see in detail how to do it.
>>
>>
>> %This SECONDS AAS WAIT_CHAIN FIRST_SEEN LAST_SEEN
>> 35% 5710 15.9 -> USER1:(PROGMGR) buffer busy waits [1st level bmb] ->
>> USER1:(PROGMGR) log file switch (checkpoint incomplete) -> [idle blocker
>> 1,2395,34375 (oracle_at_XXXXXXXXXXX (DBW0))] 7/25/2023 5:46 7/25/2023 5:46
>> 19% 3050 8.5 -> USER1:(PROGMGR) log file switch (checkpoint incomplete)
>> -> [idle blocker 1,2395,34375 (oracle_at_XXXXXXXXXXX (DBW0))] 7/25/2023 5:46 7/25/2023
>> 5:46
>> 12% 1910 5.3 -> USER1:(PROGCAP) ON CPU 7/25/2023 5:45 7/25/2023 5:48
>> 5% 770 2.1 -> USER1:(PROGCAP) log file switch (checkpoint incomplete)
>> -> [idle blocker 1,2395,34375 (oracle_at_XXXXXXXXXXX (DBW0))] 7/25/2023 5:46 7/25/2023
>> 5:46
>> 4% 700 1.9 -> USER1:(PROGMGR) buffer busy waits [data block] ->
>> USER1:(PROGMGR) log file switch (checkpoint incomplete) -> [idle blocker
>> 1,2395,34375 (oracle_at_XXXXXXXXXXX (DBW0))] 7/25/2023 5:46 7/25/2023 5:46
>> 2% 390 1.1 -> USER1:(PROGCAP1) buffer busy waits [data block] ->
>> USER1:(PROGCAP1) log file switch (checkpoint incomplete) -> [idle blocker
>> 1,2395,34375 (oracle_at_XXXXXXXXXXX (DBW0))] 7/25/2023 5:46 7/25/2023 5:46
>> 2% 290 0.8 -> USER1:(PROGMGR) ON CPU 7/25/2023 5:45 7/25/2023 5:50
>> 2% 280 0.8 -> RPT_USER:(JDBC Thin Client) ON CPU 7/25/2023 5:45 7/25/2023
>> 5:50
>> 2% 280 0.8 -> ADMIN:(JDBC Thin Client) ON CPU 7/25/2023 5:45 7/25/2023
>> 5:50
>> 2% 250 0.7 -> USER1:(PROGCAP) cell single block physical read: pmem cache 7/25/2023
>> 5:45 7/25/2023 5:47
>>
>> On Wed, Aug 2, 2023 at 12:10 PM Stefan Koehler <contact_at_soocs.de> wrote:
>>
>>> Hello Yudhi,
>>> Tanel, Priit and all the others already provided you good hints how to
>>> troubleshoot - so let me just focus on one of your open questions.
>>>
>>>
>>> > But is there any way possible through which we can be more certain ,
>>> it's really the same bug which is impacting us?
>>>
>>> Bug #33973908 refers to an issue with "DBWR write coalescing" - so you
>>> have several options to dive deeper here:
>>>
>>> 1) Disable "DBWR write coalescing" (as mentioned in the MOS ID) and
>>> check if issue occurs again (e.g. by setting
>>> "_db_writer_coalesce_write_limit" / "_db_writer_coalesce_area_size")
>>> 2) Profile the C-stack of DBWR(s) with low overhead, e.g. by using
>>> perf/0xtools (xCPU) and check if you can spot something in the stack that
>>> is related to "DBWR write coalescing"
>>> 3) Profile off-CPU C-stack of DBWR(s) with low overhead, e.g. by using
>>> eBPF/BCC (offcputime) and check if you can spot something in the stack that
>>> is related to "DBWR write coalescing"
>>>
>>>
>>> Best Regards
>>> Stefan Koehler
>>>
>>> Independent Oracle performance consultant and researcher
>>> Website: www.soocs.de
>>> Twitter: _at_OracleSK
>>>
>>> > yudhi s <learnerdatabase99_at_gmail.com> hat am 01.08.2023 22:56 CEST
>>> geschrieben:
>>> >
>>> > Thank you so much.
>>> >
>>> > Actually for this database, there exists an active-active HA setup
>>> (bi-directional sync is happening using golden gate replication). And we
>>> saw when the application with the same workload is running in that
>>> other/secondary database but we don't see such high buffer busy waits
>>> during the peak period.
>>> >
>>> > We have fast_start_mttr_target value set as zero in both the databases.
>>> >
>>> > And further checking the latest one entry from dba_registry_sqlpatch ,
>>> in the database in which we are getting buffer busy waits is "MERGE ON
>>> DATABASE RU 19.15.0.0.0 OF 29213893 30664385"
>>> > whereas the other/secondary database which takes that workload without
>>> any issue is "MERGE ON DATABASE RU 19.19.0.0.0 OF 35233847 33526630".So
>>> it's likely to be related to the highlighted bug related to buffer cache-
>>> which Priit mentioned. DBWR not picking up writes for some time (Doc ID
>>> 33973908.8)
>>> >
>>> > But is there any way possible through which we can be more certain ,
>>> it's really the same bug which is impacting us?
>>> >
>>> > Actually we are now live on the secondary database on which the issue
>>> is not occurring but mostly it will come again when we will move back to
>>> the primary database. However, we have AWR data and that event trend for
>>> dba_hist_system_event is saying we had a higher spike in " log file switch
>>> (checkpoint incomplete) " exactly during the same issue period. So
>>> wondering, if there exists any other waits which trend could be verified
>>> during the time to prove the point of the mentioned bug? And the bug
>>> suggests "the DB writer not picking up write for some time", so does it
>>> mean that the wait chain which we are seeing is abnormal, as its showing us
>>> the ultimate blocker as "idleblocker 1,2395,34375 (oracle_at_XXXXXXXXXXX
>>> (DBW0)" , so the idlekeyword itself pointing to the bug/idle DBW0 here?
>>>
>>
>
> --
> Ilmar Kerm
>
-- http://www.freelists.org/webpage/oracle-lReceived on Thu Aug 10 2023 - 06:51:50 CEST
- image/png attachment: Screenshot_2023-08-02_at_22.11.55.png