Re: High Buffer busy waits
Date: Wed, 2 Aug 2023 22:18:27 +0200
Message-ID: <CAKnHwtdwc8U2OQijbxmbbpcP_d3ZRGrUJcRC9ddQwUHccqxxWg_at_mail.gmail.com>
We have similar issue on an large analytic RAC with very busy write load.
I'm quite sure it is a bug, since 19.17+patch for 33973908 the problems
just stopped, but now with 19.18+33973908 the problems have resurfaced a
little again.
On Wed, 2 Aug 2023 at 21:44, yudhi s <learnerdatabase99_at_gmail.com> wrote:
> Thank you Tanel.
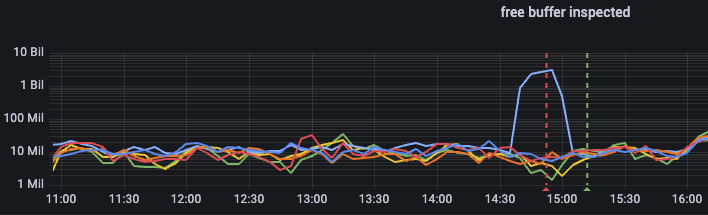
But how do we work around that is we have an alert on metric "free buffer
inspected" and when the problem is about to happen/happening, this metric
will have a dramatic increase (from millions to billions) on one instance -
and when this alert goes off, 2nd line DBA is instructed to log in to the
problematic instance and flush the buffer cache. This resolves the issue -
and since it only happens on an analytics database, it has been good
enough. I'm attaching an image from Grafana to show the dramatic jump on
log 10 scale.
Since we also have DB flash cache configured - the same dramatic jump also
happens for metric "flash cache insert skip: DBWR overloaded".
[image: Screenshot 2023-08-02 at 22.11.55.png]
>
> I tried to run the dash_wait_chains2.sql and the output is similar as
> below, i.e the ultimate blocker appears to be the DB writer only. Posting
> the output as below.
>
> As you mentioned, to see how busy the lgwr,dbwr,ckpt processes are , so i
> was trying to see to run the snapper script(in location in github
> https://github.com/tanelpoder/tpt-oracle/blob/master/snapper.sql), but it
> seems to be only fetching real time performance information from v$ views
> but not the historical views(like dba_hist**). We have had this issue occur
> in the past for a few times and lasted for 2-3minutes. It's not currently
> occurring as we are on the secondary database, but will mostly occur when
> we will move back to the primary side. So , is there any way to run snapper
> for the historical performance data(from dba_hist* views) to see how busy
> the lgwr,dbwr,ckpt processes were during those historic snap times?
>
> _at_Stefan, as the doc is stating to change those underscore
> parameters(_db_writer_coalesce*) so i believe we have to seek oracle
> blessing before changing any of those just to avoid any downside of those.
> And we have never done the profile of the C-stack of any process before, so
> we need to see in detail how to do it.
>
>
> %This SECONDS AAS WAIT_CHAIN FIRST_SEEN LAST_SEEN
> 35% 5710 15.9 -> USER1:(PROGMGR) buffer busy waits [1st level bmb] ->
> USER1:(PROGMGR) log file switch (checkpoint incomplete) -> [idle blocker
> 1,2395,34375 (oracle_at_XXXXXXXXXXX (DBW0))] 7/25/2023 5:46 7/25/2023 5:46
> 19% 3050 8.5 -> USER1:(PROGMGR) log file switch (checkpoint incomplete)
> -> [idle blocker 1,2395,34375 (oracle_at_XXXXXXXXXXX (DBW0))] 7/25/2023 5:46 7/25/2023
> 5:46
> 12% 1910 5.3 -> USER1:(PROGCAP) ON CPU 7/25/2023 5:45 7/25/2023 5:48
> 5% 770 2.1 -> USER1:(PROGCAP) log file switch (checkpoint incomplete) ->
> [idle blocker 1,2395,34375 (oracle_at_XXXXXXXXXXX (DBW0))] 7/25/2023 5:46 7/25/2023
> 5:46
> 4% 700 1.9 -> USER1:(PROGMGR) buffer busy waits [data block] ->
> USER1:(PROGMGR) log file switch (checkpoint incomplete) -> [idle blocker
> 1,2395,34375 (oracle_at_XXXXXXXXXXX (DBW0))] 7/25/2023 5:46 7/25/2023 5:46
> 2% 390 1.1 -> USER1:(PROGCAP1) buffer busy waits [data block] ->
> USER1:(PROGCAP1) log file switch (checkpoint incomplete) -> [idle blocker
> 1,2395,34375 (oracle_at_XXXXXXXXXXX (DBW0))] 7/25/2023 5:46 7/25/2023 5:46
> 2% 290 0.8 -> USER1:(PROGMGR) ON CPU 7/25/2023 5:45 7/25/2023 5:50
> 2% 280 0.8 -> RPT_USER:(JDBC Thin Client) ON CPU 7/25/2023 5:45 7/25/2023
> 5:50
> 2% 280 0.8 -> ADMIN:(JDBC Thin Client) ON CPU 7/25/2023 5:45 7/25/2023
> 5:50
> 2% 250 0.7 -> USER1:(PROGCAP) cell single block physical read: pmem cache 7/25/2023
> 5:45 7/25/2023 5:47
>
> On Wed, Aug 2, 2023 at 12:10 PM Stefan Koehler <contact_at_soocs.de> wrote:
>
>> Hello Yudhi,
>> Tanel, Priit and all the others already provided you good hints how to
>> troubleshoot - so let me just focus on one of your open questions.
>>
>>
>> > But is there any way possible through which we can be more certain ,
>> it's really the same bug which is impacting us?
>>
>> Bug #33973908 refers to an issue with "DBWR write coalescing" - so you
>> have several options to dive deeper here:
>>
>> 1) Disable "DBWR write coalescing" (as mentioned in the MOS ID) and check
>> if issue occurs again (e.g. by setting "_db_writer_coalesce_write_limit" /
>> "_db_writer_coalesce_area_size")
>> 2) Profile the C-stack of DBWR(s) with low overhead, e.g. by using
>> perf/0xtools (xCPU) and check if you can spot something in the stack that
>> is related to "DBWR write coalescing"
>> 3) Profile off-CPU C-stack of DBWR(s) with low overhead, e.g. by using
>> eBPF/BCC (offcputime) and check if you can spot something in the stack that
>> is related to "DBWR write coalescing"
>>
>>
>> Best Regards
>> Stefan Koehler
>>
>> Independent Oracle performance consultant and researcher
>> Website: www.soocs.de
>> Twitter: _at_OracleSK
>>
>> > yudhi s <learnerdatabase99_at_gmail.com> hat am 01.08.2023 22:56 CEST
>> geschrieben:
>> >
>> > Thank you so much.
>> >
>> > Actually for this database, there exists an active-active HA setup
>> (bi-directional sync is happening using golden gate replication). And we
>> saw when the application with the same workload is running in that
>> other/secondary database but we don't see such high buffer busy waits
>> during the peak period.
>> >
>> > We have fast_start_mttr_target value set as zero in both the databases.
>> >
>> > And further checking the latest one entry from dba_registry_sqlpatch ,
>> in the database in which we are getting buffer busy waits is "MERGE ON
>> DATABASE RU 19.15.0.0.0 OF 29213893 30664385"
>> > whereas the other/secondary database which takes that workload without
>> any issue is "MERGE ON DATABASE RU 19.19.0.0.0 OF 35233847 33526630".So
>> it's likely to be related to the highlighted bug related to buffer cache-
>> which Priit mentioned. DBWR not picking up writes for some time (Doc ID
>> 33973908.8)
>> >
>> > But is there any way possible through which we can be more certain ,
>> it's really the same bug which is impacting us?
>> >
>> > Actually we are now live on the secondary database on which the issue
>> is not occurring but mostly it will come again when we will move back to
>> the primary database. However, we have AWR data and that event trend for
>> dba_hist_system_event is saying we had a higher spike in " log file switch
>> (checkpoint incomplete) " exactly during the same issue period. So
>> wondering, if there exists any other waits which trend could be verified
>> during the time to prove the point of the mentioned bug? And the bug
>> suggests "the DB writer not picking up write for some time", so does it
>> mean that the wait chain which we are seeing is abnormal, as its showing us
>> the ultimate blocker as "idleblocker 1,2395,34375 (oracle_at_XXXXXXXXXXX
>> (DBW0)" , so the idlekeyword itself pointing to the bug/idle DBW0 here?
>>
>
-- Ilmar KermReceived on Wed Aug 02 2023 - 22:18:27 CEST
-- http://www.freelists.org/webpage/oracle-l
- image/png attachment: Screenshot_2023-08-02_at_22.11.55.png