Re: High Foreground Sql*Net More Data From Client wait on a snapshot standby
Date: Tue, 28 Sep 2021 23:14:27 -0400
Message-ID: <3734302d-315c-b17e-edab-5631b99ebe7c_at_gmail.com>
Hi There,
Nice case where Primary is under ODA in DC1, Standby is on Exadata in DC2 (distance between the two DCs is around 50 Miles) Line speed around 5Gb/sDatabase size is almost 4TB.
Goal is to move the primary database to ExadataTests are in progress but performances are nearly the same as in the primary ODA based system.To do the tests, the standby is converted into snapshot standby.
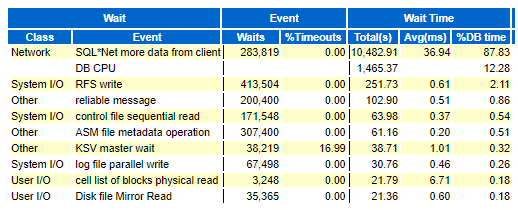
During the workload, we have a high foreground Sql*Net More Data From Client wait rate!
We can notice in Top Sessions section that the top one is coming from the primary host.
I have already managed a couple of snapshot standby scenarios but never came to this case...Could be possibly related to the low network bandwidth impacting the communication between the snapshot standby and the primary...
Will check that tomorrow...Does anyone have any ideas?
Cheersjko
What kind of network do you use? 10Gb? 1Gb? 100Mb? 10Mb? 56Kb? Is the client a VM? If the client is a VM, then hypervisor might be throttling the connection speed. Since the problem seems to be the network connection, have you done any checks? Something like "netstat -i" would be a basic check. Pay special attention on the error numbers:
/home/mgogala/bin#
netstat -i
Kernel Interface table
Iface MTU RX-OK RX-ERR RX-DRP RX-OVR TX-OK
TX-ERR TX-DRP TX-OVR Flg
enp4s0 1500 2918609 0 0 0
2224340 0 0 0 BMRU
lo 65536 1150 0 0 0
1150 0 0 0 LRU
If there are errors in either receive or transmit part, then you may have a problem. If there are only a few errors and the numbers aren't growing, those errors may be reported during the interface initialization. After that, you can get some more network statistics:
/home/mgogala/bin# netstat
-s|egrep -i "(drop|error|retrans|fail)"
4 dropped because of missing route
10 input ICMP message failed
0 ICMP messages failed
0 failed connection attempts
2607 segments retransmitted
158 packet receive errors
158 receive buffer errors
0 send buffer errors
TCPLostRetransmit: 268
2292 fast retransmits
1 retransmits in slow start
TCPSynRetrans: 182
/home/mgogala/bin#
This is a system which was communicating with the laptop which went on and off VPN. You can see the errors. When my laptop is on VPN, it doesn't allow routing to the local network. That's pretty standard. The next level of investigation would be "iptraf-ng" which would produce something like this:
If the traffic is close to the line capacity, as is here the case (my router has 1Gb LAN connections) then you should consider upgrading the network. You can measure the network speed between 2 points using iperf3. You should compare the number obtained by doing iperf3 with the nominal line capacity. If there is a discrepancy, you need to find out why is that. Of course, in addition to all those OS tools, there are also listener logs and client traces. So, my guess is that you're gonna be busy the next couple of days. Here is something to cheer you up: https://www.youtube.com/watch?v=gsNaR6FRuO0
Regards
--
Mladen Gogala
Database Consultant
Tel: (347) 321-1217
https://dbwhisperer.wordpress.com
-- http://www.freelists.org/webpage/oracle-lReceived on Wed Sep 29 2021 - 05:14:27 CEST
- image/png attachment: image.png
- image/png attachment: image.png
- image/png attachment: FM0Jm36oRstSMF0T.png