Re: Reducing idle time in Apex
Date: Wed, 16 Mar 2022 01:32:39 -0400
Message-ID: <CAFQ5ACLC003VcyNWJ-xJXEgF0rYLo-LT4YDbLFAnkkmEjC6hxA_at_mail.gmail.com>
Thanks Stefan, I'll get with my developers tomorrow to enlist their help. Hopefully I'll have an update by tomorrow afternoon.
Thanks!
-Mark
On Wed, Mar 16, 2022, 01:15 Stefan Knecht <knecht.stefan_at_gmail.com> wrote:
> If you can't find it or it's somehow somewhere else, another approach is
> to trace the page load in the database.
>
> If you are allowed & have access to edit the page, you can create a page
> process that executes a bit of plsql code and just enable 10046 that way.
> In Apex, the entire page will load in the same database session - so
> tracing it is easy. Just make sure that it has the lowest sequence number
> and executes "Before Header" (to ensure it runs before everything else) -
> and that way you will see what exactly it executes while loading the page
> and how, which then can also help to track down where & what it is.
>
> Finally, create a second page process and have it execute "After Regions"
> (or maybe that's "After Footer" in Apex 5, I don't remember for certain) to
> turn it back off again. That'll give you the most precise set of data to
> look at.
>
>
>
>
>
>
> On Wed, Mar 16, 2022 at 12:03 PM Stefan Knecht <knecht.stefan_at_gmail.com>
> wrote:
>
>> Okay it appears that we're on the right track :)
>>
>> That is some sort of process that executes and consumes the vast majority
>> of time in the segment.
>>
>> It is most likely a page process that fetches data, and the SQL is taking
>> its time; if you look at the page definition of that page as a developer in
>> the application builder, you should see sections for processes and what
>> they execute.
>>
>> It's been a while since I've used Apex 5, but IIRC there is a section
>> called "Before Regions", which is commonly used to populate the page with
>> data. Another good candidate section could be the page processes.
>>
>>
>>
>>
>> On Wed, Mar 16, 2022 at 11:49 AM Mark J. Bobak <mark_at_bobak.net> wrote:
>>
>>> Stefan,
>>>
>>> Thanks! I logged in as a developer and ran the app. I turned on Debug
>>> and clicked the problem report. Then, when the report displayed, I clicked
>>> 'View Debug'.
>>>
>>> I found a line that says 'Show First', consuming 21 seconds. This is by
>>> far the largest consumer. So, I clicked the 'View Identifier' to drill
>>> down. In there, I see lots of activity, SQL and PL/SQL and other stuff,
>>> like clear cache, http header processing, etc. Here, I found a line where
>>> the graph on the far right is completely filled in. Most of the other
>>> lines have graphs that are empty and a few have small slivers of a bar
>>> displayed. So, the one I found that seems the most problematic is 'Collection
>>> - create_collection_from_query_b, Begin fetch rows, Collection Name:
>>> PIPELINE_REPORTING', but now I'm stuck again, as I don't know what that
>>> means.
>>>
>>> Help?
>>>
>>> -Mark
>>>
>>> On Tue, Mar 15, 2022 at 10:40 PM kris rice <kris.rice_at_jokr.net> wrote:
>>>
>>>> Typical 'idle' there means the browser has no work to do meaning it's
>>>> waiting/idle. I would instead look at the network tab and the Timing tab.
>>>>
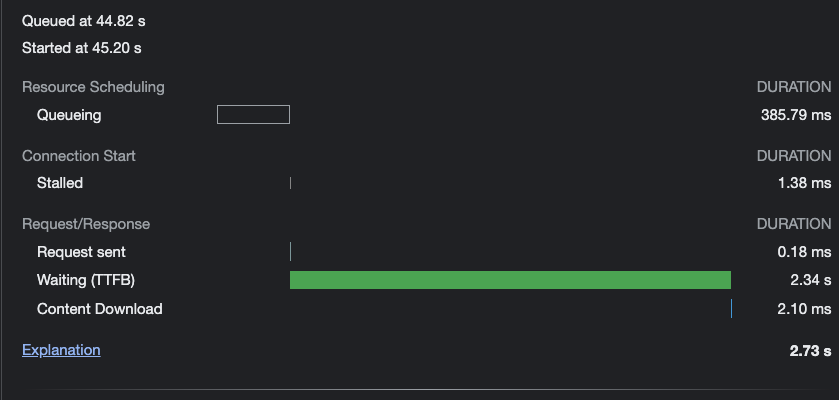
>>>> This shows that this http call times that you want to track
>>>>
>>>> - queued in the browser from 44.82 -> 45.20 365ms
>>>> - stalled 1.38 waiting on sockets
>>>> - sent to ords 0.18ms
>>>> - waiting on TTFB 2.34 <<<<<<<<< HERE is where the plsql/sql is
>>>> executing <<<<<<<<<<
>>>> - 2.1ms to download the payload
>>>>
>>>>
>>>>
>>>>
>>>>
>>>> [image: image.png]
>>>>
>>>> On Tue, Mar 15, 2022 at 9:53 PM Stefan Knecht <knecht.stefan_at_gmail.com>
>>>> wrote:
>>>>
>>>>> When logged on as a developer (log on to the workspace itself, not
>>>>> just the application directly) you will see the developer toolbar at the
>>>>> bottom of the screen. From there you can enable debug mode, load the page,
>>>>> and then view the debug output. It will show you a detailed breakdown of
>>>>> where the time is being spent.
>>>>>
>>>>>
>>>>>
>>>>> On Wed, Mar 16, 2022 at 8:26 AM Mark J. Bobak <mark_at_bobak.net> wrote:
>>>>>
>>>>>> Thanks Mark
>>>>>>
>>>>>> Rich,
>>>>>>
>>>>>> We are using ORDS/Tomcat/Apache, with AJP connection for
>>>>>> Apache<-->Tomcat.
>>>>>>
>>>>>> -Mark
>>>>>>
>>>>>> On Tue, Mar 15, 2022 at 2:47 PM Rich J <rich242j_at_gmail.com> wrote:
>>>>>>
>>>>>>> What are you using to serve up the APEX pages? I believe APEX 5
>>>>>>> still supported the embedded PL/SQL gateway. It's very slow for even a
>>>>>>> single user, although I don't recall where in the response time that
>>>>>>> slowness occurred. Once I converted to ORDS/Tomcat, the response was
>>>>>>> snappy...
>>>>>>>
>>>>>>> My $.02,
>>>>>>> Rich
>>>>>>>
>>>>>>> On Tue, Mar 15, 2022 at 12:35 PM Mark W. Farnham <mwf_at_rsiz.com>
>>>>>>> wrote:
>>>>>>>
>>>>>>>> I don’t know Apex much.
>>>>>>>>
>>>>>>>>
>>>>>>>>
>>>>>>>> The only reason I’m chiming in is that “idle” could be send more
>>>>>>>> data to client with some problem getting the “ack” to send more. The tools
>>>>>>>> that have a built-in gimme fifty rows and then wait for a keyboard entry to
>>>>>>>> send more crank up time similarly.
>>>>>>>>
>>>>>>>>
>>>>>>>>
>>>>>>>> IF that or something like it is the problem I bet some APEX expert
>>>>>>>> could tell you how to fix it unless it is a network eccentricity or the
>>>>>>>> display machine is messed up repainting graphics.
>>>>>>>>
>>>>>>>>
>>>>>>>>
>>>>>>>> Good luck Mark. One time in Salt Lake City Jerry and I tuned the
>>>>>>>> database query in question until the database non-idle time was a blink,
>>>>>>>> but we couldn’t get the output to load on a PC in another building any
>>>>>>>> faster than (drumroll)… 44K. Outputting the report output to a machine in
>>>>>>>> the database server room made the job run in about blink plus a tiny amount
>>>>>>>> proportional to the size of the output. And I only mention that in case
>>>>>>>> your 3 seconds is fast enough, there is likely nothing to remove elapsed
>>>>>>>> time on the database server.
>>>>>>>>
>>>>>>>>
>>>>>>>>
>>>>>>>> mwf
>>>>>>>>
>>>>>>>>
>>>>>>>>
>>>>>>>> *From:* oracle-l-bounce_at_freelists.org [mailto:
>>>>>>>> oracle-l-bounce_at_freelists.org] *On Behalf Of *Mark J. Bobak
>>>>>>>> *Sent:* Tuesday, March 15, 2022 12:55 PM
>>>>>>>> *To:* ORACLE-L
>>>>>>>> *Subject:* Reducing idle time in Apex
>>>>>>>>
>>>>>>>>
>>>>>>>>
>>>>>>>> Hi guys,
>>>>>>>>
>>>>>>>>
>>>>>>>>
>>>>>>>> I'm running an Apex app (5.0.3) on Oracle Database 12.1.0.2. (Yes,
>>>>>>>> I know these are old versions.)
>>>>>>>>
>>>>>>>>
>>>>>>>>
>>>>>>>> When running a specific report, I get a very slow response. If I
>>>>>>>> do a right-click on the page, and click 'Inspect' and then click the
>>>>>>>> performance tab, and reload, I see that almost all (over 30 seconds or a 33
>>>>>>>> second response time) is 'Idle' time.
>>>>>>>>
>>>>>>>>
>>>>>>>>
>>>>>>>> What do I do with that? Can someone help me understand this? I
>>>>>>>> assume this is from the client (i.e. web server) point-of-view?
>>>>>>>>
>>>>>>>>
>>>>>>>>
>>>>>>>> I've been doing databases for many (many!) years, but I'm not an
>>>>>>>> Apex or web developer type, and never have been. The last time I was a
>>>>>>>> developer it was
>>>>>>>>
>>>>>>>> all about C and Pro*C.
>>>>>>>>
>>>>>>>>
>>>>>>>>
>>>>>>>> Can someone give this old dinosaur a clue here?
>>>>>>>>
>>>>>>>>
>>>>>>>>
>>>>>>>> Thanks,
>>>>>>>>
>>>>>>>>
>>>>>>>>
>>>>>>>> -Mark
>>>>>>>>
>>>>>>>>
>>>>>>>>
>>>>>>>>
>>>>>>>>
>>>>>>>
-- http://www.freelists.org/webpage/oracle-lReceived on Wed Mar 16 2022 - 06:32:39 CET
- image/png attachment: image.png