| Many graphs in a repeating frame [message #557075] |
Fri, 08 June 2012 11:39  |
 |
msalvat
Messages: 4
Registered: June 2012
Location: Venezuela
|
Junior Member |
|
|
|
Hi, I have a graph inside a repeating frame, but every time a run the report, it doesn't bring me all de graph, generally skip the last one, for example i show one graph per location but never show me the last ones. What can i do? If I ask 4 location, it bring me 3, if I ask 5 it bring me 4.
|
|
|
|
|
|
|
|
| Re: Many graphs in a repeating frame [message #557308 is a reply to message #557141] |
Mon, 11 June 2012 14:56  |
 |
Littlefoot
Messages: 21823
Registered: June 2005
Location: Croatia, Europe
|
Senior Member
Account Moderator |
|
|
I have difficulties in trying to imagine what you did.
Therefore, I made up my own example - I created a report. Using a wizard, I created a layout based on
-- Q1
select deptno
from dept
where deptno < :par_deptno
Then I manually added another query (Q2):
-- Q2
select deptno, ename, sal
from emp
I linked these two queries by the DEPTNO column and let the wizard create a chart within the Q1's repeating frame. I ran it, and - depending on PAR_DEPTNO values, it created as many charts within the repeating frame as I expected. This is how the layout looks like for PAR_DEPTNO = 30 (a little bit tiny, sorry for that - above are salaries in department 10, below are employees in department 20):
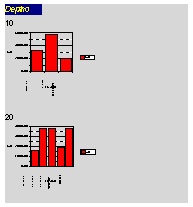
If you could create a similar example, it would be easier to detect what is going on.
-
 Attachment: chart_1.jpg
(Size: 9.88KB, Downloaded 2339 times)
|
|
|
|
|
|

