| creating a chart of creation date/times [message #550832] |
Thu, 12 April 2012 14:39  |
 |
newprogrammerSQ
Messages: 48
Registered: April 2012
|
Member |
|
|
Hopefully this will help someone else too:
I want to create a chart(probably best with scatter) that shows at least:
1. Peak times of record creation according to each day so displayed every 2 hours
Each record is timestamped in the format: 11-APR-2012 20:31:24
Table for the records are is 'Sales'
Sales_Reference
Sales_Creation
I have tried the simple wizard however can't figure out the sql code required to complete the chart correctly..
|
|
|
|
|
|
| Re: creating a chart of creation date/times [message #550836 is a reply to message #550835] |
Thu, 12 April 2012 14:53  |
|
newprogrammerSQ
Messages: 48
Registered: April 2012
|
Member |
|
|
hello again !...
Ive attempted to create a line graph and this is the code right now:
select null link, CALL_CREATION label, CALL_REFNO value1
from "HELPDESKAPP"."HELPDESK_CALL"
which is a total mess atm! is this what you require ?
X Axis shouuld be Time (Hours)
Y Axis Number of calls in 10's or whatever
If you think the data will suit a better chart then let me know 
[Updated on: Thu, 12 April 2012 14:55] Report message to a moderator |
|
|
|
|
|
|
|
| Re: creating a chart of creation date/times [message #550852 is a reply to message #550839] |
Fri, 13 April 2012 01:02 |
 |
Littlefoot
Messages: 21823
Registered: June 2005
Location: Croatia, Europe
|
Senior Member
Account Moderator |
|
|
I'm sorry, but I don't understand what you are saying as your messages are in contradiction.
Once you say that you have a table named SALES with columns SALES_REFERENCE and SALES_CREATION.
Next time you say that query you use selects CALL_CREATION and CALL_REFNO from HELPDESK_CALL.
Which one is true?
"Test case" I asked should look like this:create table sales
(sales_reference number,
sales_creation date
);
insert all
into sales (sales_reference, sales_creation) values (1, to_date('11.04.2012 20:31.24', 'dd.mm.yyyy hh24:mi:ss'))
into sales (sales_reference, sales_creation) values (2, to_date('11.04.2012 21:45.20', 'dd.mm.yyyy hh24:mi:ss'))
into sales (sales_reference, sales_creation) values (3, to_date('12.04.2012 02:15.20', 'dd.mm.yyyy hh24:mi:ss'))
into sales (sales_reference, sales_creation) values (4, to_date('12.04.2012 08:16.33', 'dd.mm.yyyy hh24:mi:ss'))
select * from dual;
Based on such a test case, we would be able to create a graph and suggest how to do that.
This seems to be quite straightforward; I can't imagine what you might have done wrong.
|
|
|
|
|
|
|
|
|
|
| Re: creating a chart of creation date/times [message #551272 is a reply to message #551262] |
Mon, 16 April 2012 14:46 |
|
newprogrammerSQ
Messages: 48
Registered: April 2012
|
Member |
|
|
create table helpdesk_call
(call_refno number,
call_creation date
);
insert all
into helpdesk_call (call_refno, call_creation) values (1, to_date('11.04.2012 20:31.24', 'dd.mm.yyyy hh24:mi:ss'))
into helpdesk_call (call_refno, call_creation) values (2, to_date('11.04.2012 21:45.20', 'dd.mm.yyyy hh24:mi:ss'))
into helpdesk_call (call_refno, call_creation) values (3, to_date('12.04.2012 02:15.20', 'dd.mm.yyyy hh24:mi:ss'))
into helpdesk_call (call_refno, call_creation) values (4, to_date('12.04.2012 08:16.33', 'dd.mm.yyyy hh24:mi:ss'))
select * from dual;
there thats helpdesk_call table with the columns call_refno and call_creation
|
|
|
|
| Re: creating a chart of creation date/times [message #551298 is a reply to message #551272] |
Tue, 17 April 2012 00:03 |
|
Littlefoot
Messages: 21823
Registered: June 2005
Location: Croatia, Europe
|
Senior Member
Account Moderator |
|
|
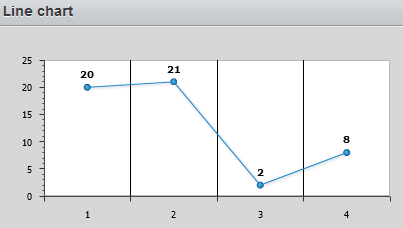
OK then, here's how I understood what you said: from these values, you need to select HOURS (20, 21, 02, 08) and display them on the graph. If that's so, here's a query:select null link,
call_refno,
to_number(to_char(call_creation, 'hh24')) call_creation_hour
from helpdesk_call
order by call_refno
and the result:
If that's not what you are looking for, could you describe it once again? No problem if you draw it on a piece of paper, scan and attach with your next message.
|
|
|
|
|
|
| Re: creating a chart of creation date/times [message #551338 is a reply to message #551337] |
Tue, 17 April 2012 07:44 |
|
Littlefoot
Messages: 21823
Registered: June 2005
Location: Croatia, Europe
|
Senior Member
Account Moderator |
|
|
Quote:should I change the data type in my sql workshop to varchar2
No, not even in your dreams!!!
Date values should be stored in DATE datatype columns. If you choose VARCHAR2, expect a miserable end of your life (well, just kidding, but this will bring numerous problems, sooner or later).
To display dates in different format, use TO_CHAR function with appropriate format mask.
P.S. As far as I can tell, a VALUE column returned by a chart query must be a NUMERIC value. It means that you can't display these values in any format you want; choose something like HH24MISS or YYYYMMDD or similar (numberic) interpretation of a date value.
[Updated on: Tue, 17 April 2012 07:48] Report message to a moderator |
|
|
|
|
|
|
|
|
|
|
|
| Re: creating a chart of creation date/times [message #551343 is a reply to message #551342] |
Tue, 17 April 2012 07:56 |
|
Littlefoot
Messages: 21823
Registered: June 2005
Location: Croatia, Europe
|
Senior Member
Account Moderator |
|
|
SQL> select to_char(sysdate, 'day') from dual;

TO_CHAR(S
---------
tuesday

SQL>
If you want to chart NUMBER OF CALLS, you'll first have to CALCULATE that number, and then display it. This is not a difficult task.
P.S. Here's an example:
SQL> select to_char(hiredate, 'day') n_day,
  2         count(*) cnt
  3  from emp
  4  group by to_char(hiredate, 'day');

N_DAY            CNT
--------- ----------
monday             1
thursday           5
sunday             1
tuesday            3
wednesday          2
friday             2

6 rows selected.

SQL>
[Updated on: Tue, 17 April 2012 07:58] Report message to a moderator |
|
|
|
|
|
|
|
|
|
|
|
|
|


